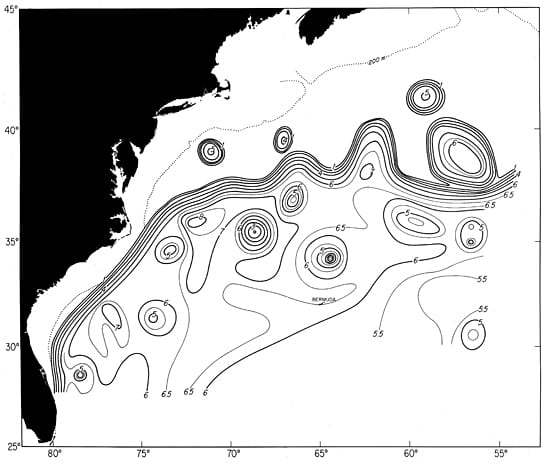
This chart of 1975 hydrographic and satellite data shows the path of the Gulf Stream and a number of warm-core and cold-core rings (north and south of the stream, respectively) that have spun off it. This was the first attempt to create a “weather map” for the northwestern Atlantic Ocean. The flow is charted using the depth (in hundreds of meters) of a water layer registering 59°F (15°C), which years of research have shown to be a reliable indicator of the surface current. (Illustration courtesy of Woods Hole Oceanographic Institution Archives)
More Content From :
How the Ocean Works


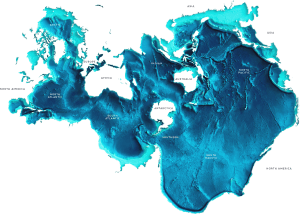
Image and Visual Licensing
WHOI copyright digital assets (stills and video) on this website can be licensed for non-commercial use upon request and approval. Please submit your request via our Media Request Form.
For assistance or accessibility accommodations, call (508) 289-2647.