A computer screen capture shows a map of the sampling locations for the research crew sailing on the RV Oceanus in May and June 2008 to study harmful algal blooms in New England waters. The “MapTech” software program allows the researchers to plot—and later readjust—exactly where they want to take samples of seawater and sediments. It also allows the ship crew to plot the shortest path from point A to B. Black dots show the sampling locations chosen before the cruise, while green dots show locations that were added after the science party decided to search for the edges of the ocean bloom of Alexandrium. (Photo by Bibiana Gomez-Crespo, Woods Hole Oceanographic Institution)
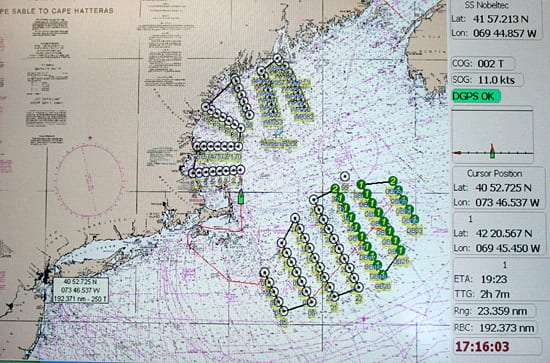
Image and Visual Licensing
WHOI copyright digital assets (stills and video) on this website can be licensed for non-commercial use upon request and approval. Please submit your request via our Media Request Form.
For assistance or accessibility accommodations, call (508) 289-2647.