Racing an undersea volcano
Scientists hurry to map the seafloor before the next volcanic eruption at the East Pacific Rise
Estimated reading time: 6 minutes
In April 2021, WHOI scientist Dan Fornari and a team of collaborators and students returned to the East Pacific Rise at 9°50' North to complete a map of an undersea volcano that they believe will erupt within the next five years.
The East Pacific Rise (EPR) lies west of Costa Rica and is just one small part of a 60,000-mile-long mid-ocean ridge system-the longest mountain range on the planet. The EPR at this location is a fast-spreading ridge where oceanic crust is formed, separating at about 11 centimeters (~4 inches) per year.
"It is one of very few places where consecutive deep-sea eruptions have occurred on a human timescale, and that we have been able to observe, map, and sample," says Fornari.
The EPR axis in the study area has experienced two recorded eruptions over the last three decades (in 1991-1992, and again in 2005-2006), and supports a hydrothermal vent system teeming with life. Another eruption could help Fornari and his collaborators understand the mechanisms that drive volcanic activity at mid-ocean ridges, and show biologists how long it takes for life to return to an area newly covered by lava. But to gain this new understanding, scientists need a highly-detailed map of the area before a new eruption changes it dramatically.
Early maps of the EPR (at 9°50'N) were made using ship-based multibeam sonar and only revealed features in approximately 40-by-40-meter squares. At that resolution, the maps missed important detail-for example, the axial summit trough, where past eruptions have occurred, is only 40-to-60-meters wide in some areas. In 2001, detailed near-bottom mapping was carried out at the EPR study area with one of the first autonomous underwater vehicles used for academic oceanographic research. That vehicle-called ABE, (short for "Autonomous Benthic Explorer"), was developed at WHOI by Albert Bradley, Barrie Walden, and Dana Yoerger. ABE, which WIRED Magazine included in its list of "50 Best Robots Ever" in 2006, provided the breakthrough technology and engineering that ushered in a new era of deep-sea mapping and robotics technologies-innovation that continues to this day with its successor, the autonomous underwater vehicle (AUV) Sentry.
The maps that ABE generated in 2001 at the EPR covered about 8 square kilometers (~3 square miles), at a vertical resolution of about 5 meters (16.4 feet) using the sonar technology available at that time. Based on previous surveying of the 2005-2006 volcanic eruptions, Fornari and colleagues determined that the area to be surveyed in detail needed to cover over 100 square kilometers (~38 square miles) if all of the seafloor terrain that might be impacted by a new eruption was to be covered.
Over the last four years Fornari and collaborators Ross Parnell-Turner and Jyun-Nai Wu from Scripps Institution of Oceanography (SIO) visited the East Pacific Rise and used Sentry to produce the most extensive high-resolution bathymetric map of the 9° 50'N area. Sentry dove by night, and researchers followed in the human occupied vehicle (HOV) Alvin by day, using just-created Sentry maps to navigate to areas of scientific interest.
The latest Sentry map of the EPR study area, which combines surveys carried out in 2018, 2019 and most recently, April 2021, builds upon the success of prior mapping technologies including ABE, revealing bathymetric and morphological details of the volcanic terrain down to half a meter and covering a much wider swath of the study area that now encompasses 115-square kilometers (~44-square miles).
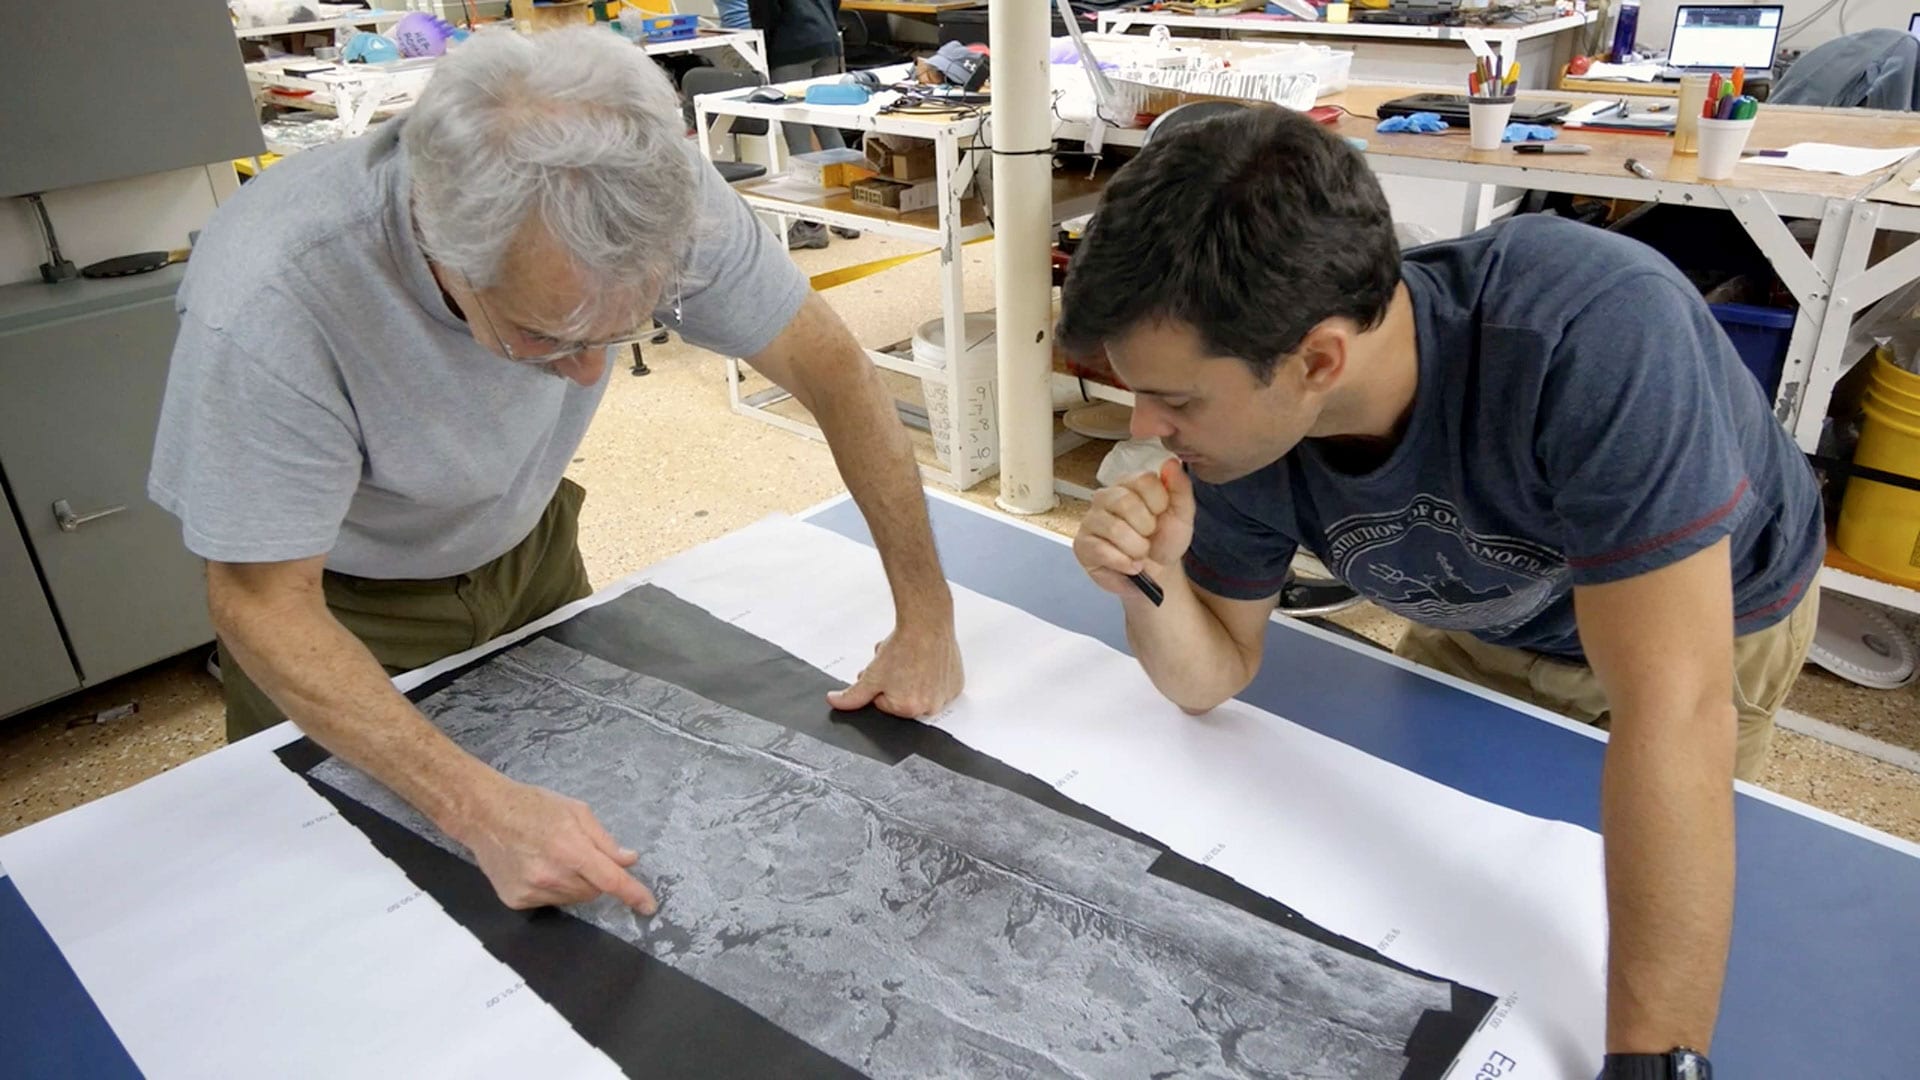
In the main lab of research vessel Atlantis in 2018, Dan Fornari (WHOI, left) and colleague Ross Parnell-Turner (Scripps) take their first look at a new map of the East Pacific Rise made using Sentry’s side-scan sonar. (Image Credit: Ken Kostel, WHOI).
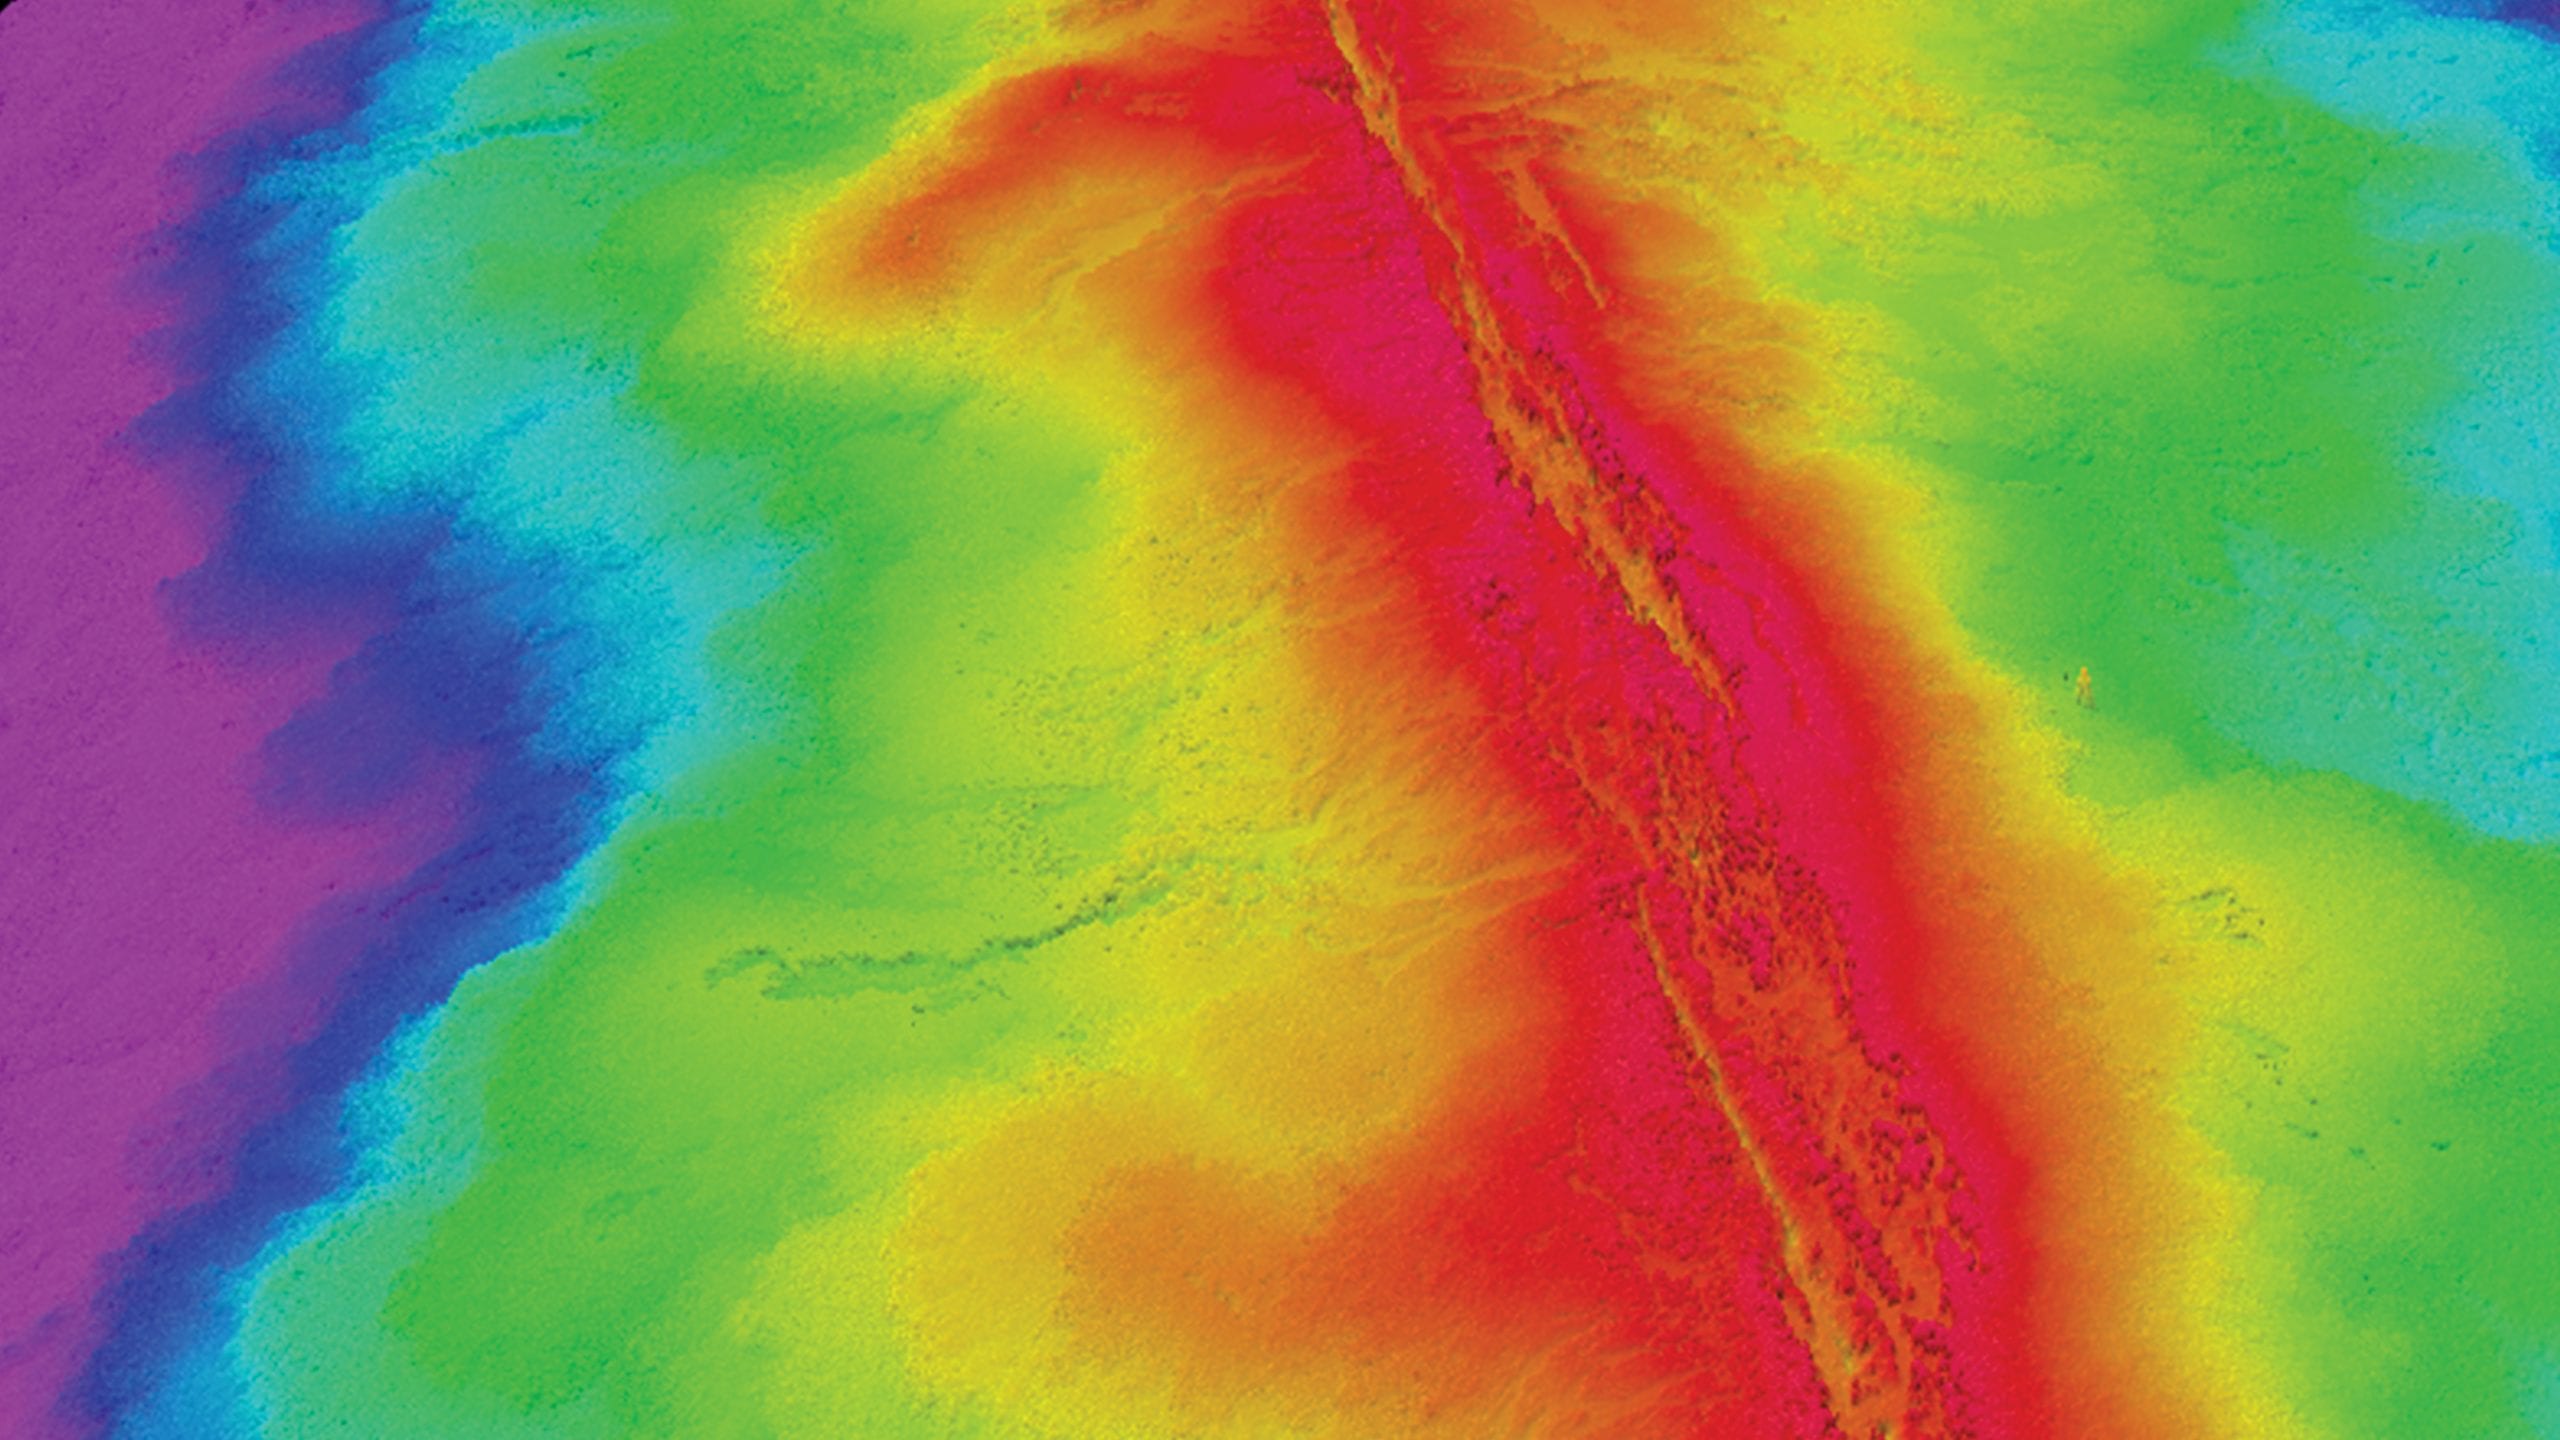
Fornari can read the completed segments of the new map like a history book. "You can see lava channels, hydrothermal vents, and lava pillars created during the last eruption, which tell you how far the lava came up before it drained back," he says. "You can see lava flows that traveled out from the axis, and measure how far they went and the flow fronts they created-at distances of hundreds of meters to nearly three kilometers from the axis."
Sentry is programmed to follow a track pattern along the seafloor. It maps the terrain using multibeam and sidescan sonar, which discern topography by sending out pulses of sound and measuring how quickly they bounce back. The end product is a map so detailed that at first glance, it looks like an aerial photograph of a mountain ridge.
An emeritus research scholar at WHOI, Fornari has spent much of his career studying the East Pacific Rise. When Fornari and collaborator Rachel Haymon of University of California Santa Barbara discovered the site in 1989, they mapped it with what was then the best deep submergence technology of the day: WHOI's ship-towed Argo imaging and sonar system.
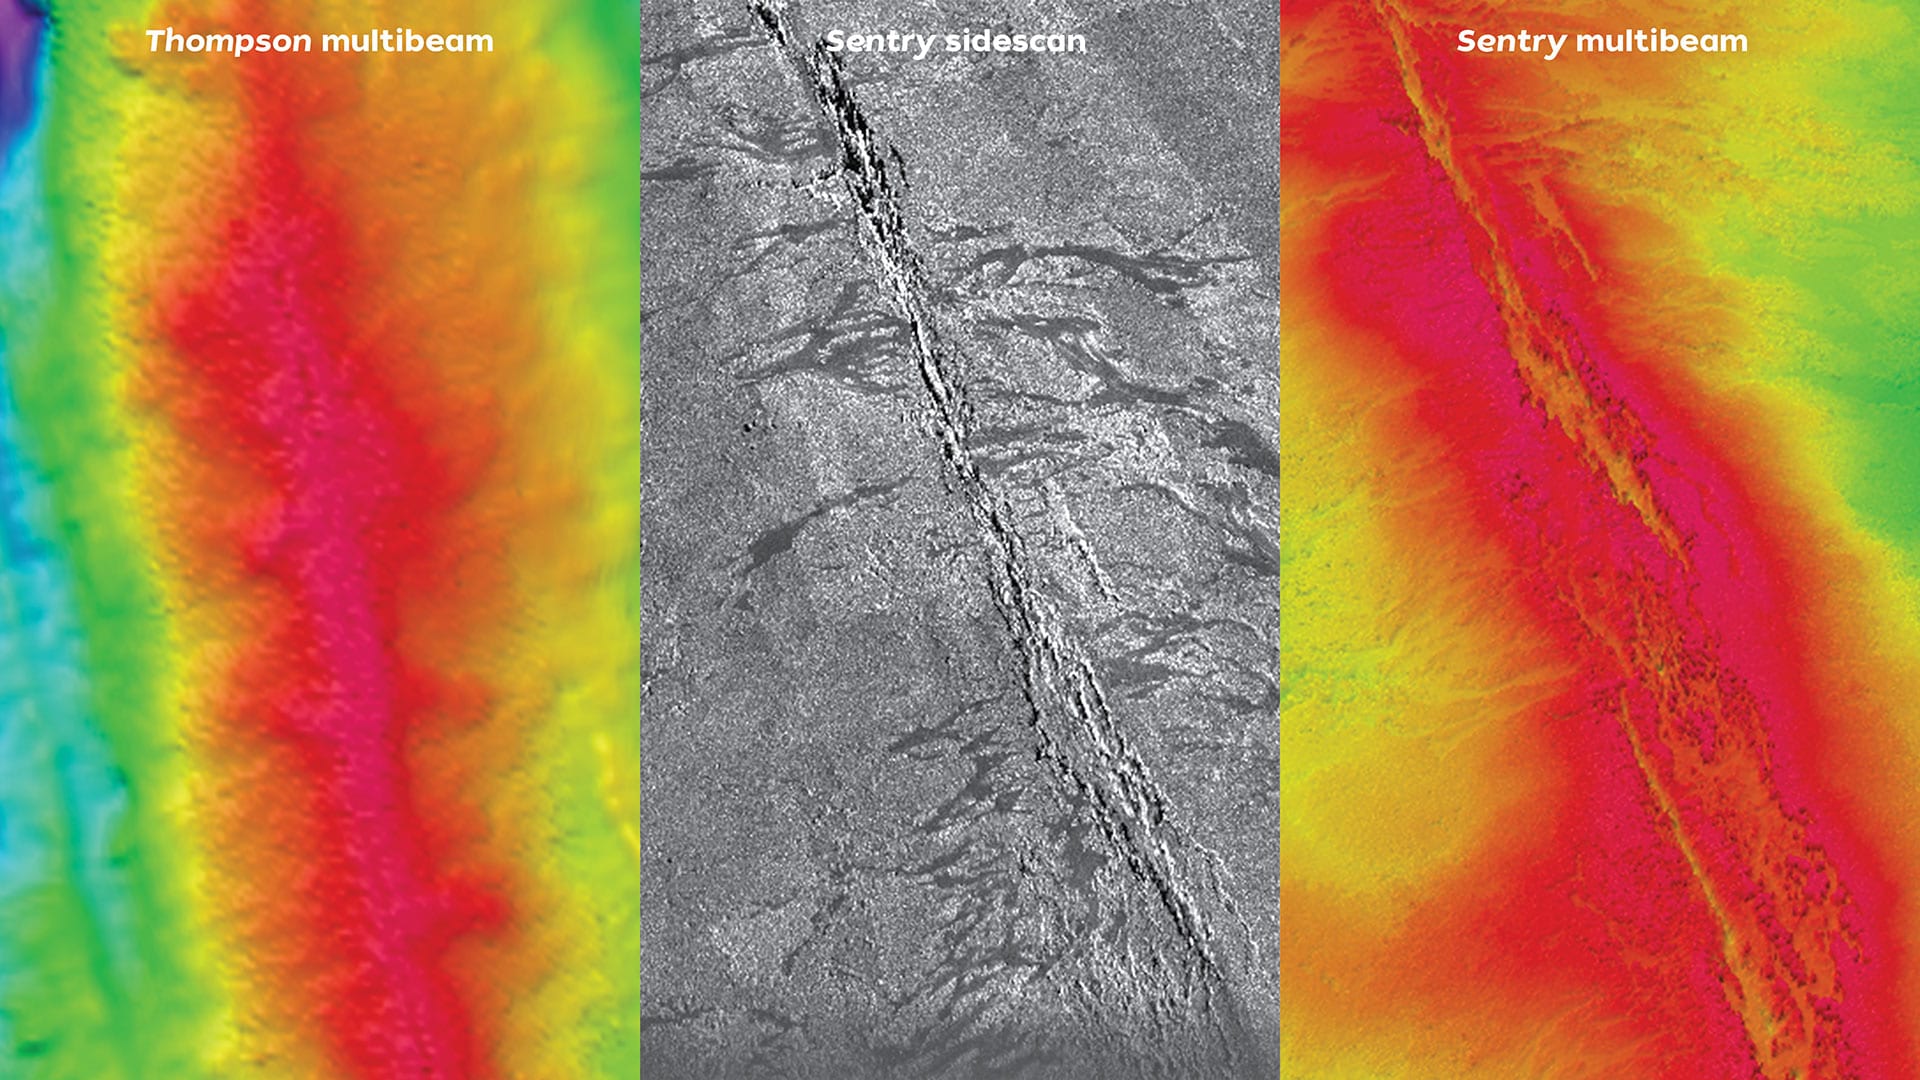
Before Sentry (and ABE), scientists mapping the East Pacific Rise mostly relied on images produced by ship-based multibeam sonar. According to Fornari, it only took a few hours to produce this relatively low-resolution map (left) using the multibeam on the R/V Thomas Thompson. In contrast, producing the detailed Sentry maps (center and right) took dozens of 10-to-14-hour dives during two cruises in 2018 and 2019. In the sidescan sonar image (center), the dark, finger-like features are channelized lava flows. In the Sentry multibeam sonar image (right), the 40-to-60-meter-wide axial summit trough is visible with unprecedented clarity. (Sentry data: Jyun-Nai Wu and Ross Parnell-Turner, SIO. Image Credit: Dan Fornari, WHOI)
Before Sentry (and ABE), scientists mapping the East Pacific Rise mostly relied on images produced by ship-based multibeam sonar. According to Fornari, it only took a few hours to produce this relatively low-resolution map (left) using the multibeam on the R/V Thomas Thompson. In contrast, producing the detailed Sentry maps (center and right) took dozens of 10-to-14-hour dives during two cruises in 2018 and 2019. In the sidescan sonar image (center), the dark, finger-like features are channelized lava flows. In the Sentry multibeam sonar image (right), the 40-to-60-meter-wide axial summit trough is visible with unprecedented clarity. (Sentry data: Jyun-Nai Wu and Ross Parnell-Turner, SIO. Image Credit: Dan Fornari, WHOI)
For biologists who study hydrothermal-vent life near undersea volcanos, a high-resolution map is invaluable, says MIT-WHOI Joint Program graduate student Lauren Dykman.
"It allows us to know the disturbance history of the different vents, which is crucial to our research on how long vent communities take to recover, and their resilience to disturbance," says Dykman, who studies the East Pacific Rise as a member of the Mullineaux Benthic Ecology Lab at WHOI. She participated in the last two Sentry mapping cruises in 2019 and 2021, and made her very first dive in Alvin in December 2019, guided by a map that Sentry produced just the night before.
Developing the capability to map an area with Sentry and then dive on the same site with Alvin or the remotely operated vehicle (ROV) Jason-often on the same day-has been no easy feat. But it has been a crucial operational strategy that started with the ABE vehicle over 15 years ago and continues to this day with Sentry working in tandem with other deep-submergence vehicles. Members of WHOI's National Deep Submergence Facility, which operates all three vehicles, have worked for years to achieve it.
"It used to be that we looked out the window of the sub and our navigation was to go in a certain direction by a number of meters," says submersible pilot Bruce Strickrott, who manages the Alvin Group. "Our maps weren't quite hand-drawn, but they were not nearly as detailed as they are now. Now, we actually load a Sentry map into Alvin and drive straight to the area we are interested in."
During their latest expedition to the EPR, completed in late April 2021, Fornari and his colleagues sent Sentry on nightly mapping missions to fill the gaps in their current map. With Alvin midway through a long-planned upgrade, the scientists used Jason to sample and image areas around hydrothermal vents and place logging devices to measure their temperature over months-to-years. With Jason and Sentry working in tandem to expand understanding of the mid-ocean ridge, when the next eruption happens, scientists will be ready.
This mapping project is funded by the National Science Foundation, through a grant awarded to Dan Fornari (WHOI), Thibaut Barreyre (U. Bergen), Ross Parnell-Turner (SIO), and Jill McDermott (Lehigh U.)