Timothy K. Stanton*, Joseph D. Warren*, Peter H. Wiebe**,
Mark C. Benfield1, Charles H. Greene2
* Woods Hole Oceanographic Institution, Department of Applied Ocean Physics and Engineering, Woods Hole, MA 02534;
** Woods Hole Oceanographic Institution, Department of Biology, Woods Hole, MA 02543;
1 Louisiana State University, Coastal Fisheries Institute, Baton Rouge, LA 70803;
2 Ocean Resources and Ecosystems Program, Center for the Environment, Department of Geological Sciences, Cornell University, Ithaca, NY 14853
ABSTRACT
A multifrequency acoustic backscatter survey system (BIOMAPER-II) has been used to map an internal wave in the Gulf of Maine, a shallow water coastal region north of Cape Cod, MA. The acoustic visualization of the internal wave showed the wave to consist of two scattering layers, each with a distinctly different frequency response. The response of one is consistent with the scattering by shrimp-like zooplankton while the response of the other is consistent with the scattering by turbulence-induced sound speed microstructure. Preliminary results are presented and implications for quantitative mapping of internal waves and zooplankton are discussed.
INTRODUCTION
Internal waves have long been visualized with acoustic backscattering survey systems (Munk and Garrett, 1973; Proni and Apel, 1975; Orr and Hess, 1978; Haury et al., 1983; Seim et al., 1995; Wiebe et al., 1997). The visualization has provided quantitative information on key parameters of the waves including their amplitude and wavelength. This information can be determined directly from the echograms because of the resolution of the acoustic system: the acoustic beamwidth and range resolution are small enough in comparison with the larger scale features so the acoustic system could resolve them.
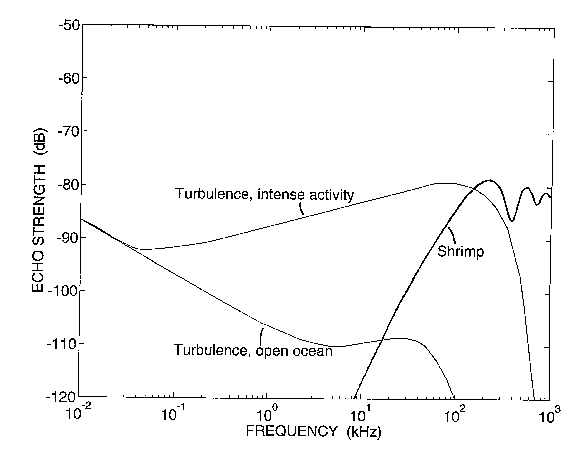
Although the larger scale features of the internal wave can be directly determined from an acoustic echogram, the mechanism causing the acoustic scattering by the internal wave cannot. Intrinsic in this mechanism are parameters such as size, numerical density, material properties, and taxa of particulate scatterers that may be present (typically zooplankton) as well as parameters such as scale and dissipation rate of smaller scale features of turbulence that may be present (Goodman, 1990; Goodman et al., 1992; Stanton et al., 1994; Seim et al., 1995; Fig 1 of this paper). Understanding the scattering physics of zooplankton and turbulence will help provide methods for estimating their respective parameters.
ACOUSTIC SURVEY
A survey was made in the Gulf of Maine during a cruise in October, 1997 (Fig. 2). The site was selected because of the important biological activity in relation to the bathymetric and physical oceanographic properties of the region. A cruise track was designed so that a significant portion of the Gulf was surveyed.
The survey involved towing the BIOMAPER-II (BIo-Optical Multi-frequency Acoustical and Physical Environmental Recorder) (Austin et al., submitted; Fig. 3 of this paper). This system contains a wide suite of acoustical, optical, and environmental sensors. The acoustic sensors consist of two identical sets of transducers, one set looking upward and the other looking downward. The frequencies in each set are 43 kHz, 120 kHz, 200 kHz, 420 kHz, and 1 MHz. The optical sensors includes a high resolution underwater camera (video plankton recorder or VPR) that can resolve features of individual zooplankton. Also included in the optics package are an optical transmissometer and fluorometer, and various optical spectral devices (absorption, attenuation, down-welling irradiance, and up-welling irradiance). Depth, temperature, and conductivity sensors are included in the environmental sensor package. During the transects, BIOMAPER-II was either tow-yoed up and down throughout the water column or towed near the surface making use of only the downlooking acoustic systems.
OBSERVATION AND MEASUREMENTS OF INTERNAL WAVE
During the latter part of R/V ENDEAVOR Cruise 307, a search was made for an internal wave packet like one seen earlier in the cruise in the same area (Greene et al., 1997). In that search, a strong internal wave was observed first with the ship-board radar (Fig. 4) and then with the downlooking transducers on the BIOMAPER-II (Fig. 5) as the ship steamed in a direction parallel to the direction of propagation of the internal wave. The internal wave showed two distinct scattering layers, one centered at about 25 m depth and the other at about 50 m depth. The peak-to-peak (internal wave) amplitude of each layer was of order 25 m.
After the near-surface tow was completed, the ship was turned around and the wave was surveyed three more times, once with BIOMAPER-II lowered to the depth of 50 m which corresponded to the lower scattering layer of the wave, once at a depth of about 25-30 m depth which corresponded to the depth of the upper scattering layer, and once where the BIOMAPER-II system was towed near the surface again, but while the MOCNESS multiple net system was towed at various depths so that zooplankton could be caught. Towing BIOMAPER-II through the different scattering layers allowed the short range sensors (optics, temperature, etc.) to directly measure parameters of the wave.
The two scattering layers have a distinctly different frequency response (Fig. 6). The upper layer shows the scattering to be higher at the lower frequencies than at the higher frequencies and the lower layer is the opposite. In fact, the upper layer is barely detectable at 420 kHz and the lower layer is not at all detectable at 43 kHz.
COMPARISON WITH SCATTERING PREDICTIONS AND IMPLICATIONS
Comparison of the observed frequency response of the different layers illustrated in Fig. 6 with the predicted response for intense turbulence and zooplankton in Fig. 1 shows that the response of the upper layer is consistent with the scattering by turbulence and that the response of the lower layer is consistent with the scattering by shrimp-like zooplankton. Both responses are consistent with those corresponding types of scatterers in that the shapes of the curves are similar. However, the observed values are about 10-15 dB higher. This could easily be due to the intensity of the turbulence and size or number of zooplankton being different in this region than what was used in the predictions. Nonetheless, it is the shape of the curves that are indicative of the scattering processes. These correlations between the respective scattering processes indicate that apparently the zooplankton are acting as tracers of the internal wave in the lower layer and are dominating the scattering. In the upper layer, it appears that turbulence is present in the internal wave and is dominating the scattering.
These observations have important implications in the use of mapping internal waves and zooplankton in the ocean:
MAPPING INTERNAL WAVES: a) Whether zooplankton, turbulence or other types of scatterers dominate the scattering, larger scale features of the internal waves can be directly measured from acoustic echograms. However, proper selection of the acoustic frequency is essential. If turbulence is present and dominates the scattering, parts or all of the wave may not be detectable at the higher acoustic frequencies (including frequencies at which certain acoustic doppler current profilers operate). b) Multifrequency acoustic systems can be used to discriminate between sources of scattering in the internal wave. c) As suggested in this and previous studies, under some conditions internal waves can dominate the acoustic scattering. When that is the case, there is potential for other parameters related to scale and dissipation rates not resolved by the echograms (ones connected with the scattering process) to be inferred from the scattering. This inference is a subject for future studies by these authors.
MAPPING ZOOPLANKTON: It is generally assumed that marine life such as zooplankton dominates the backscattering throughout most of the water column. As a result, scattering levels from the water column are usually directly converted into biomass values. For conditions under which turbulence significantly contributes to, or even dominates, the scattering, biomass estimates would be in error if the contributions due to the turbulence are not taken into account. Certainly, the rate of occurrence of turbulence with high enough levels for it to dominate the scattering is low. However, it is believed that the turbulence can play a major role in biological processes (Rothchild and Osborn, 1988; Evans, 1989; Davis et al., 1991; Yamazaki et al. 1991). As a result, regions where high levels of turbulence occur may be the focus of certain biological studies, which places importance on understanding the role of turbulence in acoustic mapping of the region.
CONCLUSIONS
In conclusion, acoustic scattering of an internal wave is a complex function of various parameters of the turbulence field and abundance and composition of the zooplankton population that may be present. These preliminary results are suggestive of the care one needs to make in quantitatively mapping the turbulence and zooplankton, especially when one is in the presence of the other. Further analysis is underway which will test these inferences by comparing the observed acoustic scattering with predictions of the scattering based upon direct measurements of the zooplankton population and estimates of the turbulence field.
ACKNOWLEDGEMENTS
The authors are grateful to the captain and crew of the RV Endeavor for their support of the cruise in 1997 as well as Shirley Barkley for preparation of the manuscript of this paper. This research was supported by the Office of Naval Research, National Science Foundation, and the Woods Hole Oceanographic Institution Graduate Education Program.
REFERENCES
Davis, C.S., G.R. Flierl, P.H. Wiebe, and P.J.S. Franks, 1991. "Micropatchiness, turbulence and recruitment in plankton," J. Mar. Res. 49, 109-151.
Evans, G.T., 1989. "The encounter speed of moving predator and prey," J. Plankton Res. 11, 415-417.
Greene, C., P. Wiebe, H. Sosik, M. Benfield, and A. Bucklin, 1997. R/V ENDEAVOR Cruise 307 to Georges Bank Report (7-17 October 1997). 47 pgs.
Haury, L.R., P.H. Wiebe, M.H. Orr and M.G. Briscoe, 1983. "Tidally generated high frequency internal wave packets and their effects on plankton in Massachusetts Bay," J. Mar. Res. 41, 65-112.
Munk, W.H. and J.C.R. Garrett, 1973. "Internal wave breaking and microstructure (The chicken and the egg)." Boundary Layer Meteorol. 4, 37-45.
Orr, M.H. and F.R. Hess, 1978. "Remote acoustic monitoring of natural suspensenate distributions, active suspensenate and slope/shelf water intrusions." J. Geophys. Res. 83, 4062-4068.
Proni, J.R. and J.R. Apel, 1975. "On the use of high-frequency acoustics for the study of internal waves and microstructure," J. Geophys. Res. 80, 1147-1151.
Rothschild, B.J. and T.R. Osborn, 1988. "Small-scale turbulence and plankton contact rates," J. Plankton Res. 80, 465-474.
Seim, H.E., M.C. Gregg, and R.T. Miyamoto, 1995. "Acoustic backscatter from turbulent microstructure," Atmos. Ocean. Tech. 12, 367-380
Stanton, T.K., P.H. Wiebe, D. Chu, and L. Goodman, 1994. "Acoustic characterization and discrimination of marine zooplankton and turbulence," ICES J. Mar. Sci., 51, 469-479.
Wiebe, P.H., T.K. Stanton, M.C. Benfield, D.G. Mountain, and C.H. Greene, 1997. "High-frequency acoustic volume backscattering in the Georges Bank coastal region and its interpretation using scattering models," IEEE J. Ocean. Eng. 22, 445-464
Yamazaki, H., T.R. Osborn, and K.D. Squires, 1991. "Direct numerical
simulation of planktonic contact in turbulent flow," J. Plankton Res. 13,
629-643.
Figure 1. Acoustic scattering levels due to turbulence for intense
area of the ocean such as in internal waves, turbulence in the open ocean
away from intense fields, and 2-cm-long zooplankton averaged over angle
of orientation. From Stanton et al. (1994).
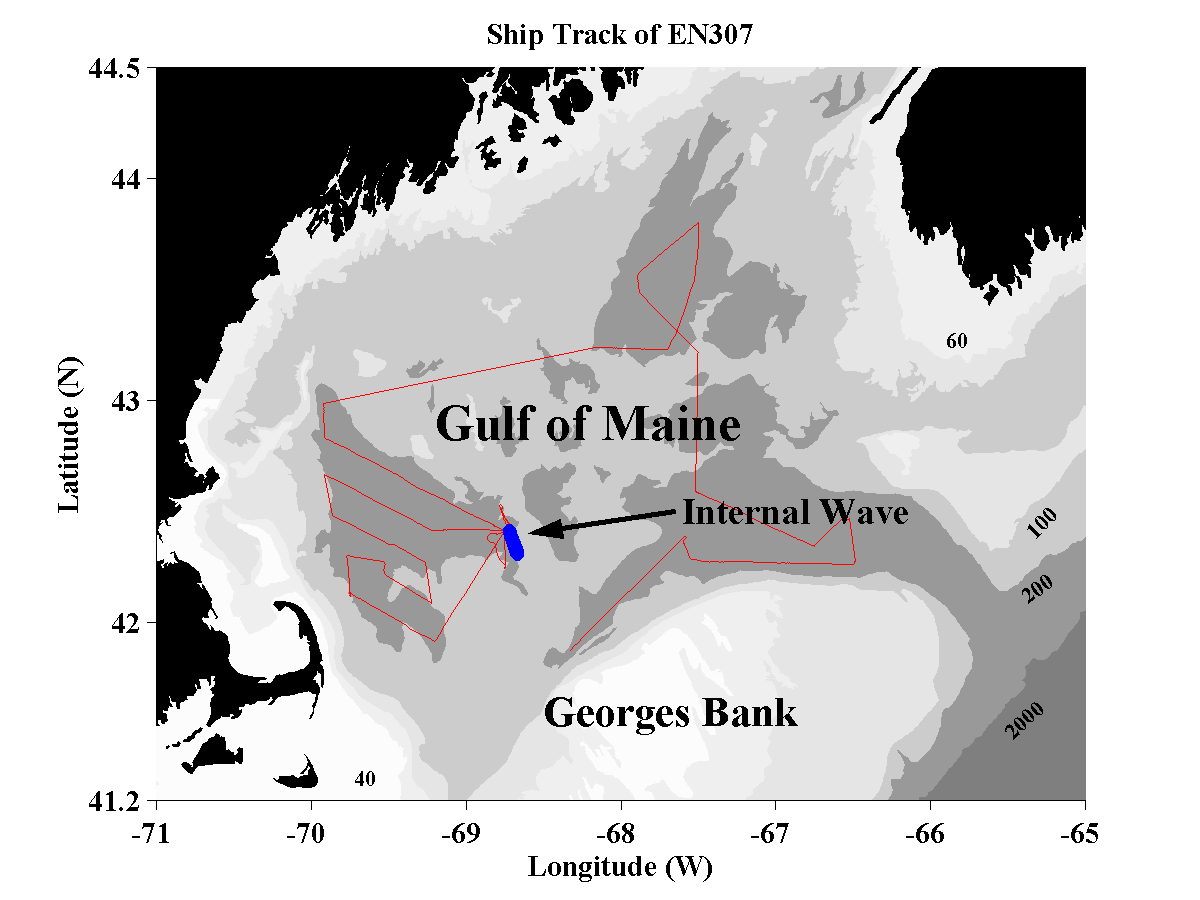
Figure 2. Cruise track in October 1997 survey of Gulf of Maine
region. The section in which the internal wave was mapped is indicated.
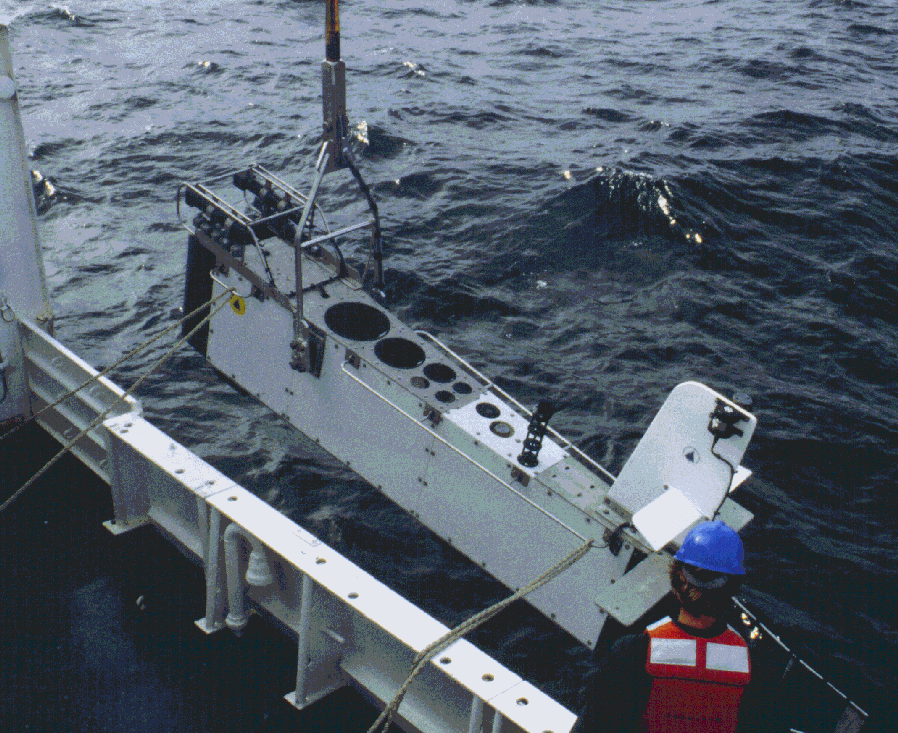
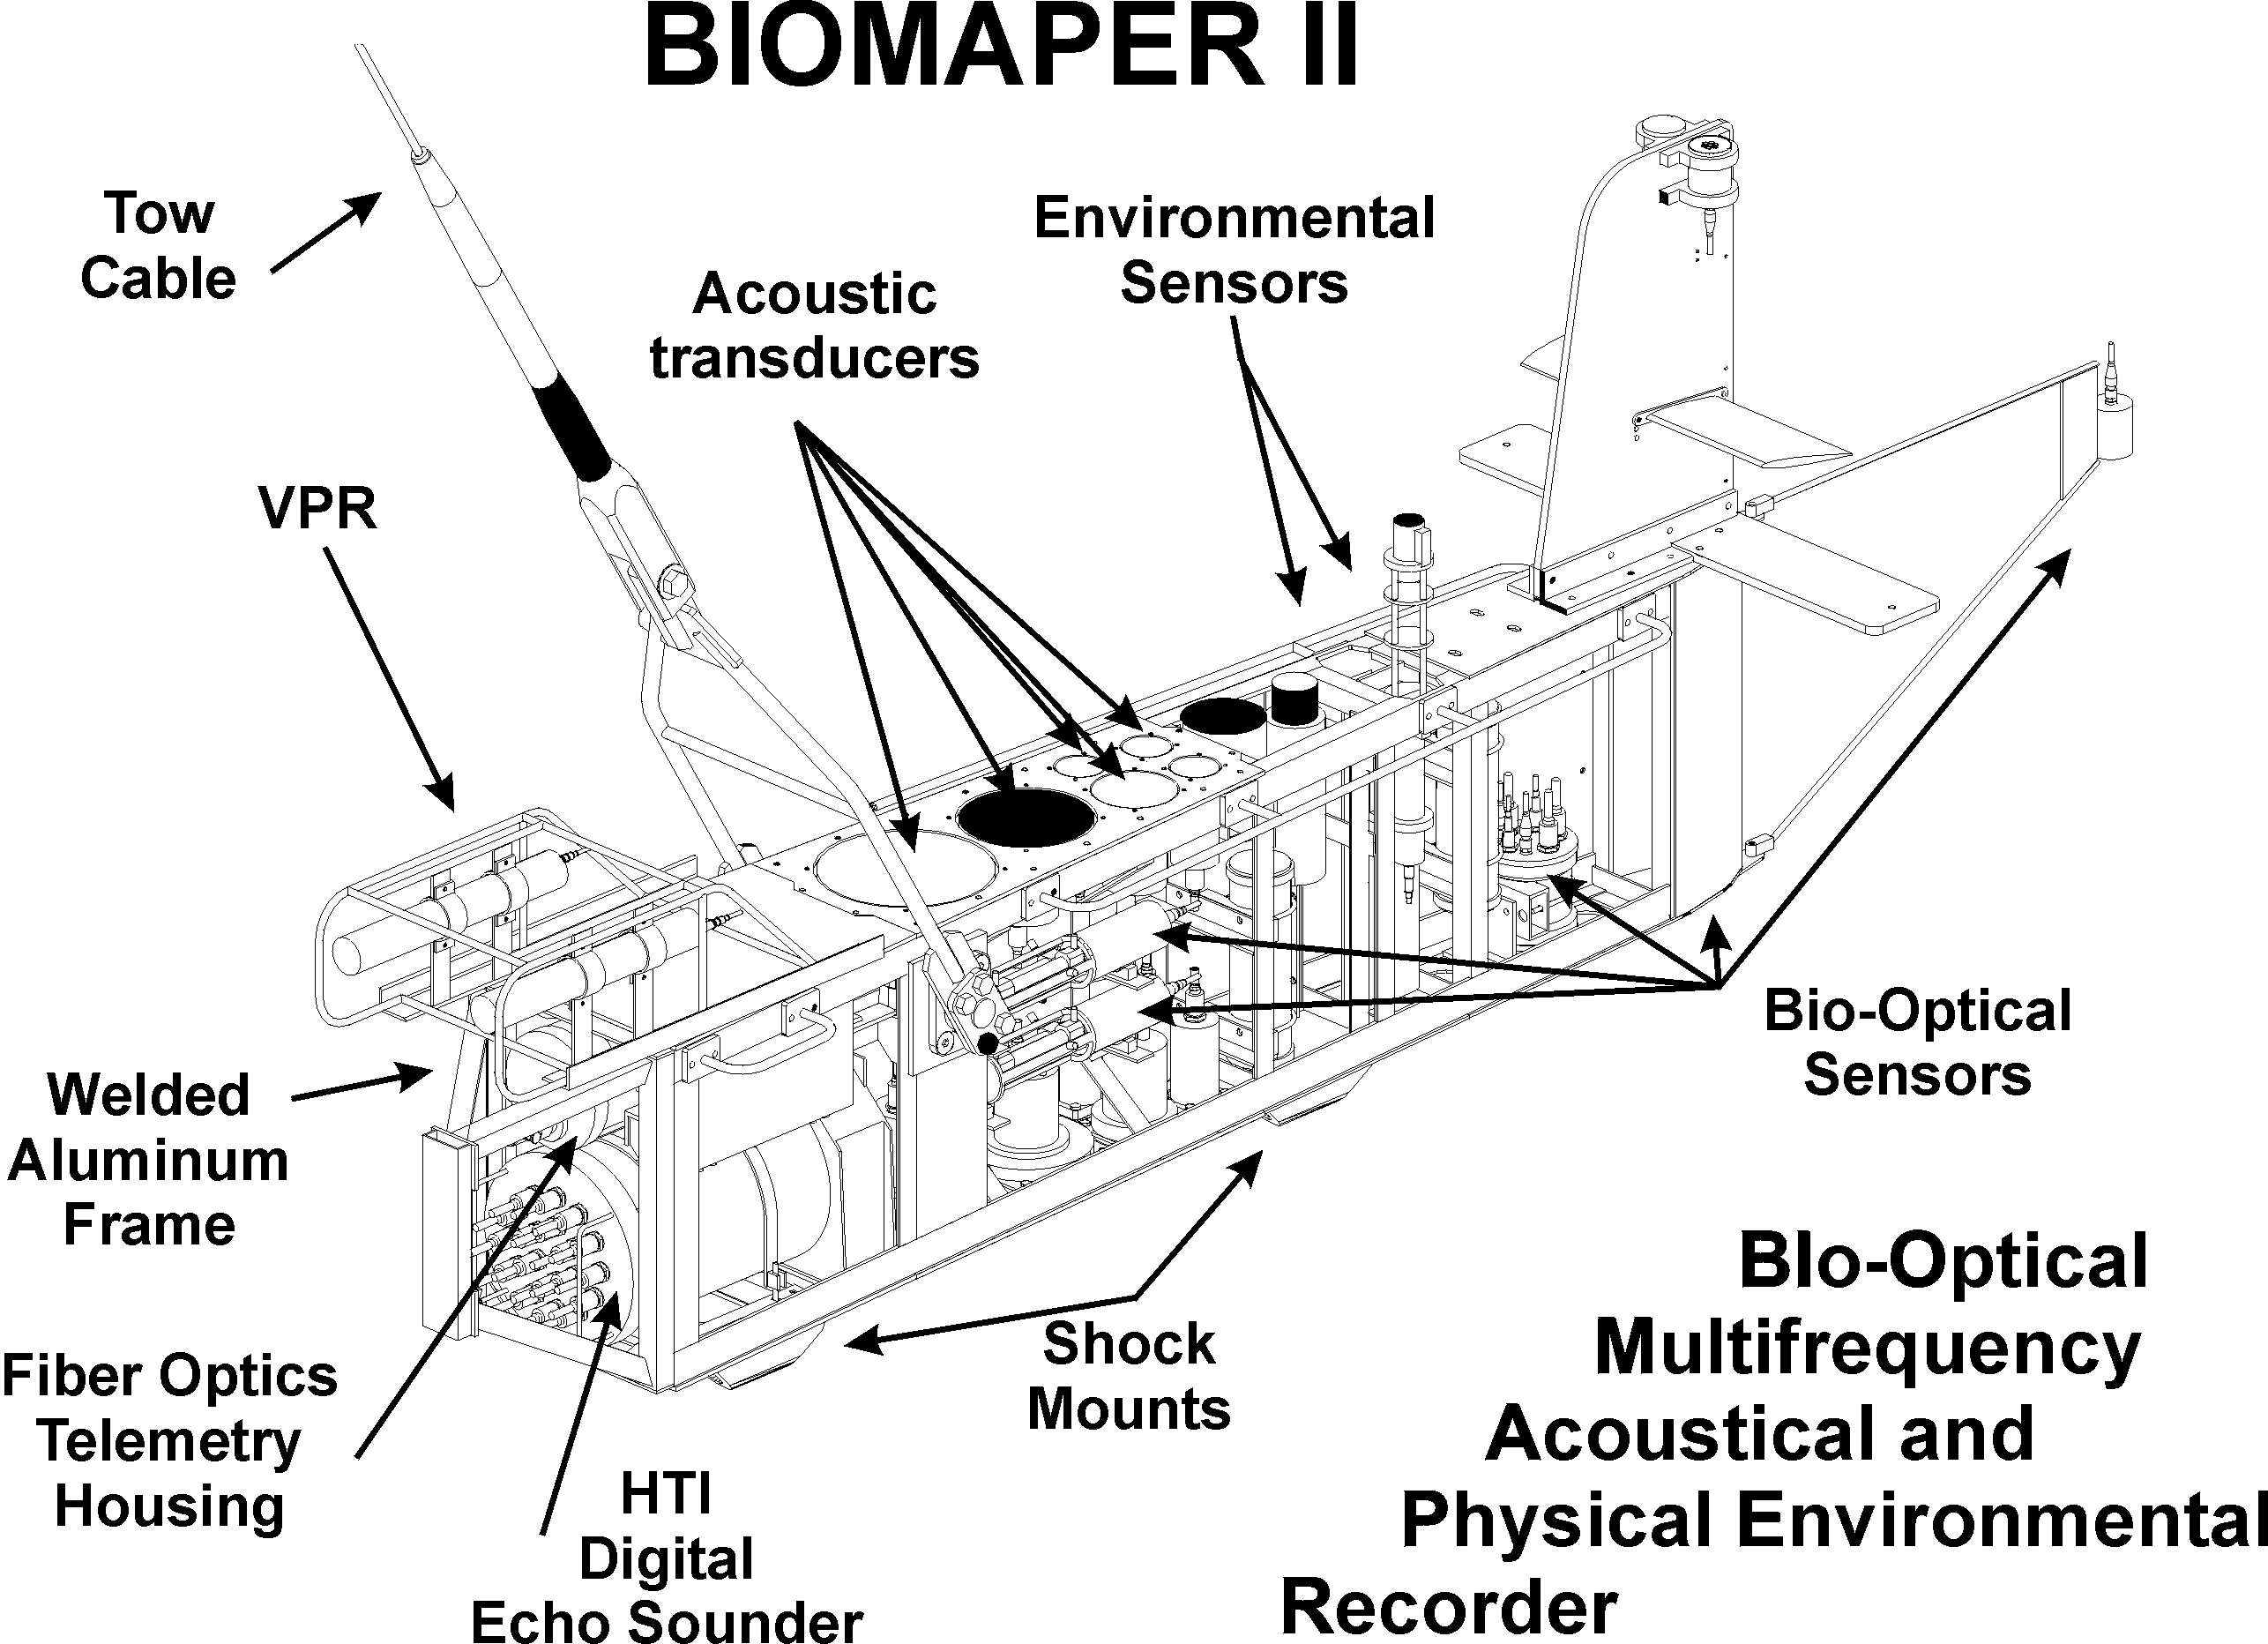
Figure 3. BIOMAPER-II towed system. The system contains five
acoustic transducers looking up (43 kHz to 1 MHz) and an identical set
looking down, an underwater camera system for recording images of zooplankton,
and various other optical systems and environmental sensors. Optical fibers
in the core of the tow cable allow large volumes of data to be transmitted
to the ship-board computers. Austin et al. (submitted).
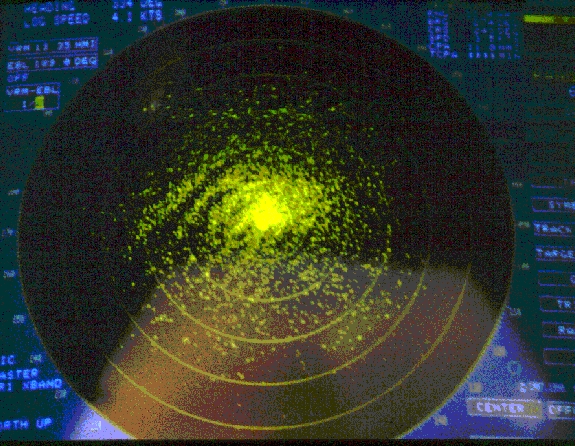
Figure 4. Radar image of internal wave as viewed from the ship's
radar system at the sea surface.
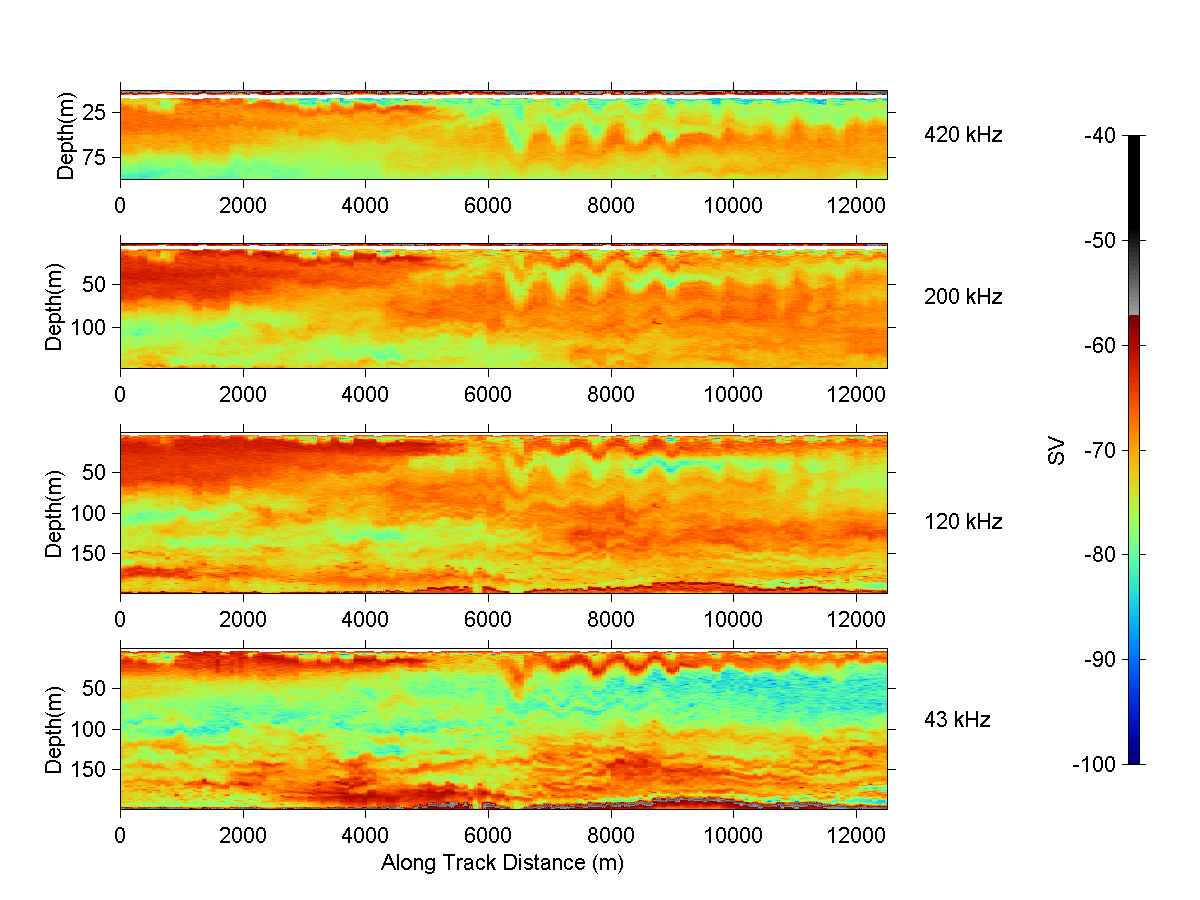
Figure 5. Acoustic image of internal wave within the ocean's
interior at four acoustic frequencies. The color is modulated according
to level of volume scattering strength (red corresponds to a high echo
level, blue corresponds to a low level). Although the vertical dimensions
of each plot are different due to the different range of each frequency,
the scales are the same so that one-for-one comparisons can be made.
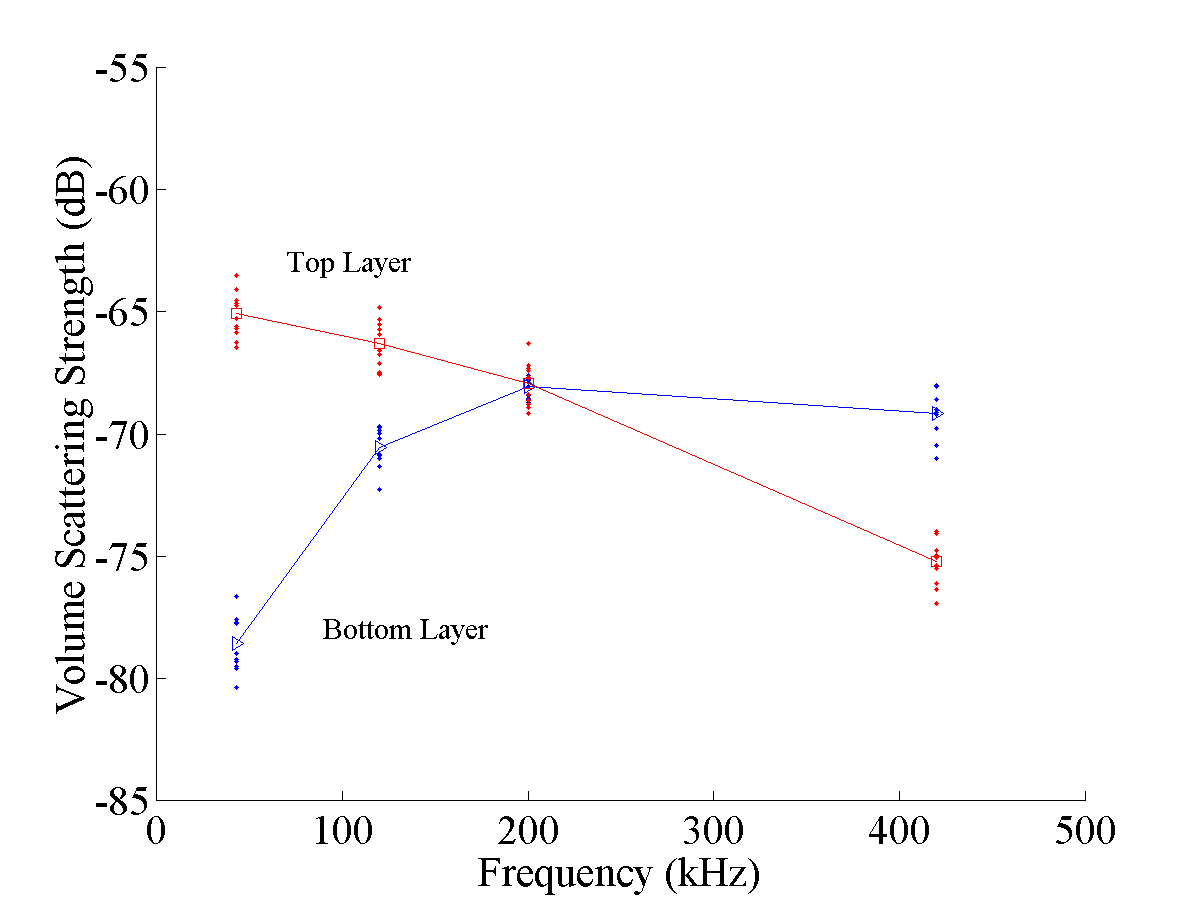
Figure 6. Acoustic volume scattering strength versus frequency as measured in a small section of the upper and lower scattering layers of the internal wave illustrated in Fig. 5. Each average scattering strength was determined by averaging the levels within a layer, first on a linear scale before the logarithm was performed. One layer was first sampled at one frequency (where the return was strongest) along its peak value at approximately one-quarter wavelength intervals (internal wave wavelengths). The layer was then sampled at precisely those locations for the other frequencies.