Pump-During-Probe Fluorometry of Individual Cells at Sea
Olson, RJ, Sosik HM, Chekalyuk AM
Biology Department
Woods Hole Oceanographic Institution
This research has been supported by grants from the Department of Energy
(DE-FG02-93ER61693) and NSF (OPP-9530718 and OCE-9819206).
Background: Active fluorescence techniques are becoming commonly
used to monitor the state of the photosynthetic apparatus in natural populations
of phytoplankton, but at present these are bulk water measurements which
average all the fluorescent material in each sample. Here we describe two
instruments which combine individual-cell "pump-during-probe" (PDP) measurements
of chlorophyll (Chl) fluorescence induction, on the time scale of 30 to
100 ms, with flow cytometric or visual characterization
of each cell.
Methods: In the PDP flow cytometer, we measure the time course
of Chl fluorescence yield during a 150 ms excitation
flash provided by an argon ion laser; each particle is subsequently classified
as in a conventional flow cytometer. In the PDP microfluorometer, individual
cells in a sample chamber are visually identified, and fluorescence excitation
is provided by a blue light-emitting diode which can be configured to provide
a saturating flash and also a subsequent series of short flashlets. This
sequence allows both saturation and relaxation kinetics to be monitored.
Results: Phytoplankton from natural samples and on-deck iron-enrichment
incubation experiments in the Southern Ocean were examined with each
PDP instrument, providing estimates of the potential quantum yield
of photochemistry and the functional absorption cross section for photosystem
2, for either individuals (for cells larger than a few micrometers) or
populations (for smaller cells).
Conclusions: Results from initial field applications indicate
that single-cell PDP measurements can be a powerful tool for investigating
the nutritional state of phytoplankton cells and the regulation of phytoplankton
growth in the sea.
(Click on images for better resolution)

Fig. 1. Schema of the PDP microscope. In early work, the LED was controlled
by an analog circuit based on a 555 timer chip, and signals were captured
with a digital oscilloscope and subsequently transferred to a personal
computer (PC). Longpass, shortpass, bandpass and neutral density filters
are indicated as LP, SP, BP and ND, respectively.

Fig. 2. Optical layout of the PDP flow cytometer. L = lens; M = mirror;
D = dichroic; S = splitter; F = filter.

Fig. 3. Timing diagram for the PDP flow cytometer. (A) represents schematic
signals from the three laser beams. Panels B-G denote the timing of the
control and signal processing functions.
(A) The IR, PDP, and classification beams are aimed and focused while
observing signals with an oscilloscope. Scattered light from a particle
passing through the IR beam triggers the system (time = 0). For clarity,
the PDP signal is shown exaggerated in size relative to the other two signals.
The shape of the unmodulated PDP beam profile (i.e., a signal from a bead
with the modulator kept open) is indicated by a dotted line; the modulated
signal would cause a vertical rise in the bead signal at 550 ms.
The signal shape generated by the passage of a healthy cell through the
modulated PDP beam is indicated by the solid line.
(B) The system is prevented from responding to new trigger signals during
the period required for measuring and storing the data from the triggering
particle (33 ms).
(C) The IR laser is turned off after triggering, to reduce background
during the subsequent measurements.
(D) PDP signal acquisition (200 ms) begins
as the cell approaches the measuring region.
(E) After 50 ms of PDP background data has
been acquired, the PDP modulator opens to start the fluorescence induction
measurement.
(F) The classification beam shutter (which has a minimum 800 ms
delay) opens after the PDP measurement is completed.
(G) The classification pulse stretchers are reset after the opening
of the shutter, but before the cell passes through the strong beam. The
IR pulse stretcher is reset after the IR laser has been turned back on
for the next sample.

Fig. 4. PDP microfluorometric measurement of a pair of Phaeocystis
cells collected in the Ross Sea, south of New Zealand.
-
Several cell pairs from a colony viewed under the measurement conditions.
-
The aperture used to isolate cells of interest for the measurement is shown
at the same magnification as (A) with a 5.2 mm
bead for scale.
-
Time course of fluorescence intensity for a cell pair, reference (excitation
flash) and blank (empty field of view).
-
Time course of relative cell fluorescence yield. Least squares fit of the
data to a biophysical model yielded an estimate of Fv/Fm
of 0.40.
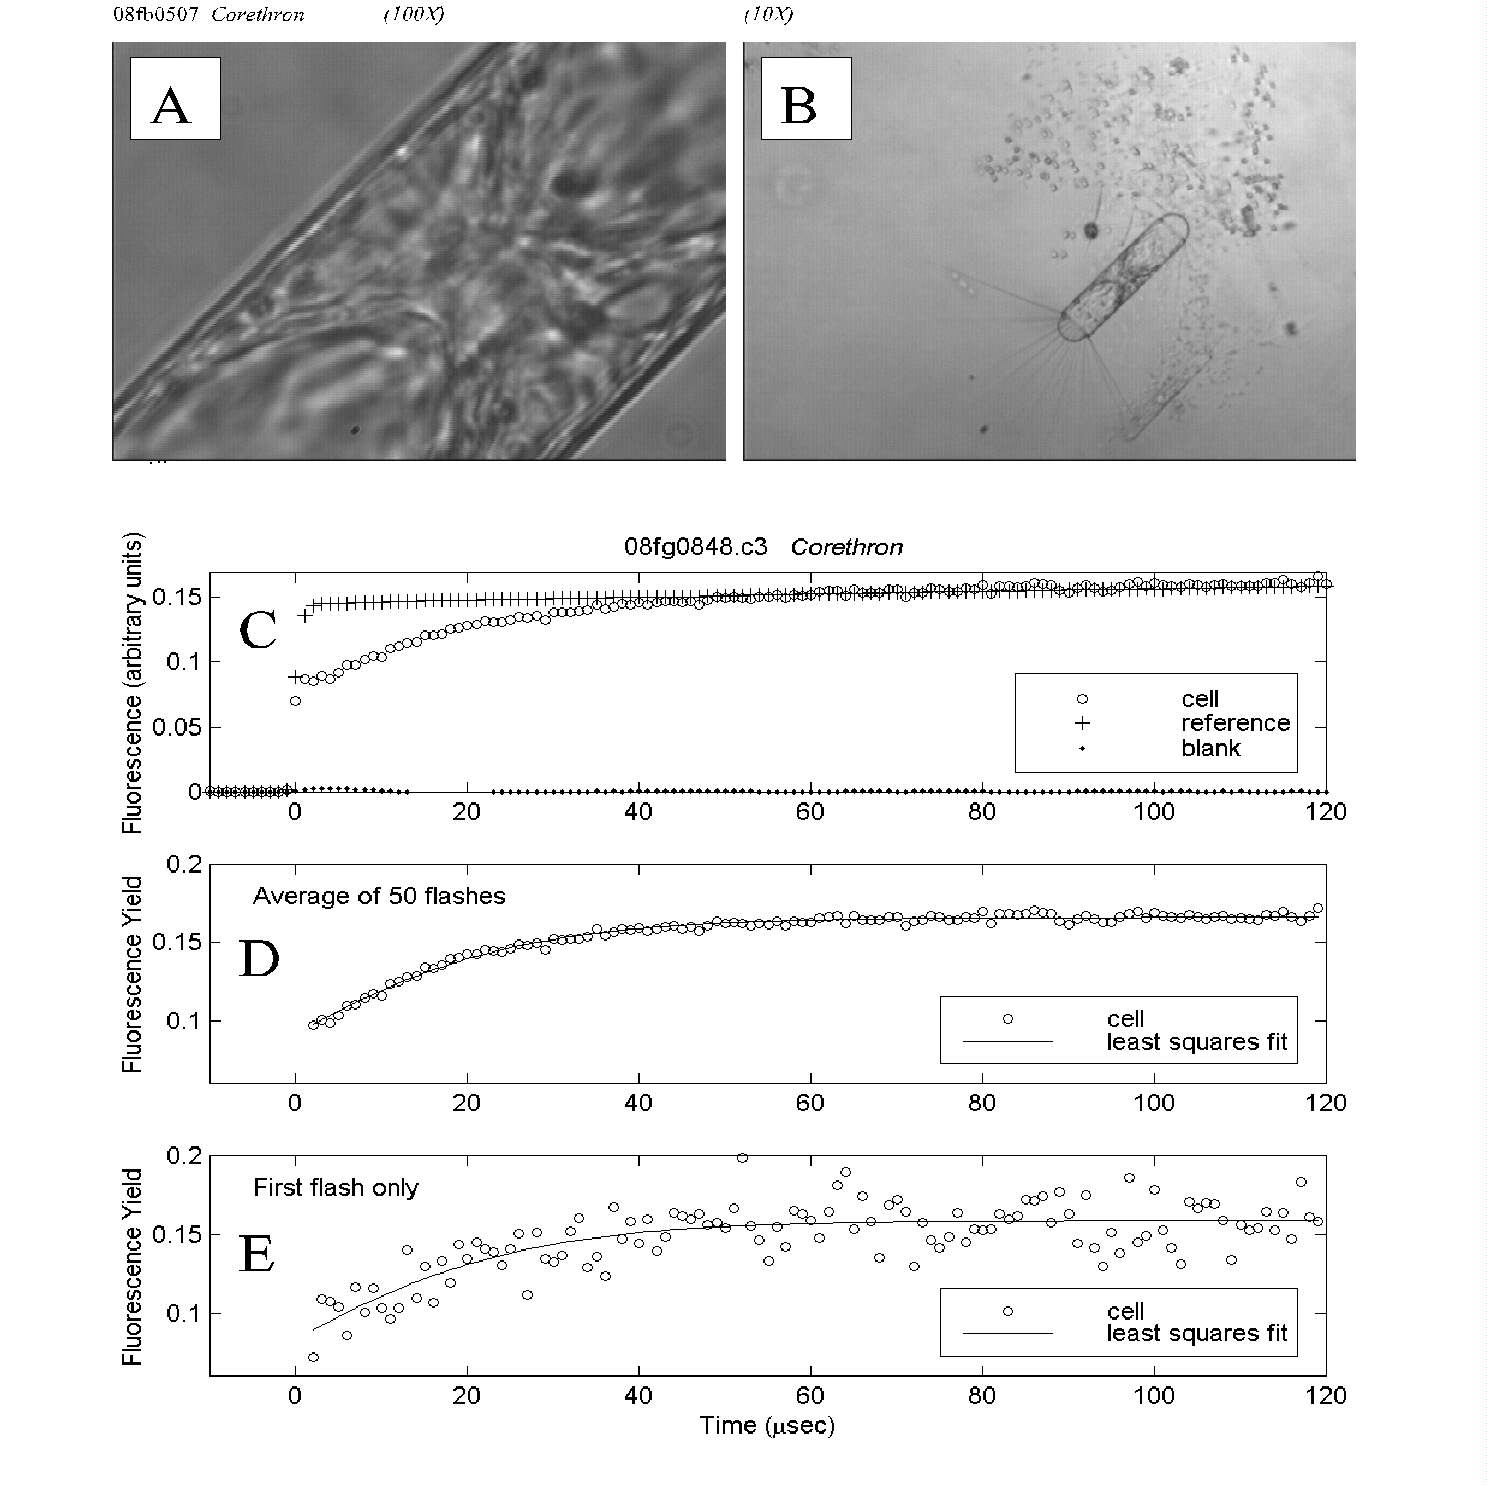
Fig. 5. PDP microfluorometric measurement of a Corethron cell.
(A) The cell as it appeared under measurement magnification; a subset
of this view was assayed using the aperture as shown in Fig. 4B.
(B) The same field at 10-fold lower magnification reveals the entire
Corethron cell as well as part of a Phaeocystis colony.
(C) Time course of fluorescence intensity for the cell, reference (excitation
flash) and blank (empty field of view), averaged over 50 flashes.
(D) Time course of cell fluorescence yield, averaged over 50 flashes.
Least squares fit of the data to a biophysical model yielded an estimate
of Fv/Fm of 0.47.
(E) Time course of cell fluorescence yield for the first flash in the
measurement series. Though the single-flash data are noisier, the estimate
of 0.50 for relative variable fluorescence was close to that for the averaged
data above.

Fig. 6. Pump-during-probe microfluorometry results for Fragilariopsis
spp. cells from the initial sample and from control and iron enriched bottles
on day 5 of an iron enrichment bottle incubation experiment south of the
Polar Front in the northern Ross Sea. While iron-treated cells exhibited
the highest average Fv/Fm , the
distribution of values was wide in each case; some cells in the initial
sample were quite "healthy" even though the average Fv/Fm
was low. Likewise, even in the iron-enriched sample,
a few cells were in poor condition.

Fig. 7. Pump-during-probe microfluorometry of Fragilariopsis
spp. (A) from the iron-enriched bottle of Fig. 6, showing the post-saturation
decay in fluorescence yield. (B) Reference signal from flash sequence.
(C) Cell fluorescence. (D) Fluorescence yield.
Note in (D) the change in scaling of the time axis between the saturation
and decay phases. In (B) and (C) the decay phase signals are shown with
the same time resolution as for the saturation phase data, but the 100
ms intervals between flashlets are omitted.

Fig. 8. PDP flow cytometric analysis of the phytoplankton in a water
sample from 30 m depth south of the Polar Front in the northern Ross Sea.
Each dot in panels A and B represents a particle with the indicated light
scattering and fluorescence values. Color coding indicates categories of
cells selected through multiparameter analysis. The fluorescence data for
each group selected was averaged (C) and normalized to that of the beads
to give fluorescence yield (D). The yields in (D) have been scaled to Fm
to facilitate comparisons of curves between populations. The number of
particles in each group were: beads = 1852, pennates = 359, cryptophytes
= 332 , "small phytoplankton" = 6493, and "large phytoplankton" = 438.
Individual cell fluorescence induction curves from the largest cells
measured (such as the one indicated by the asterisk in (A) had reasonable
signal-to-noise ratios (E); Fv/Fm for this cell was
estimated at 0.44 (F).

Fig. 9. Comparison of bulk (FRR, squares) and single-cell (PDP flow
cytometer, circles) measurements of relative variable fluorescence yield
(Fv/Fm) during an iron enrichment bottle incubation
experiment south of the Polar Front in the northern Ross Sea. Iron-enriched
(filled symbols) and control (open symbols) bottles were sacrificed at
each time point and measurements made within 1 h; results for replicate
bottles for the 2- and 5-day time points are indicated. For this "bulk"
comparison, all the cells in the flow cytometer signature were considered
as a single population; both approaches indicate an increase in the Fv/Fm
of the total phytoplankton population after iron enrichment.
Go to Olson home page
Go to Sosik home page