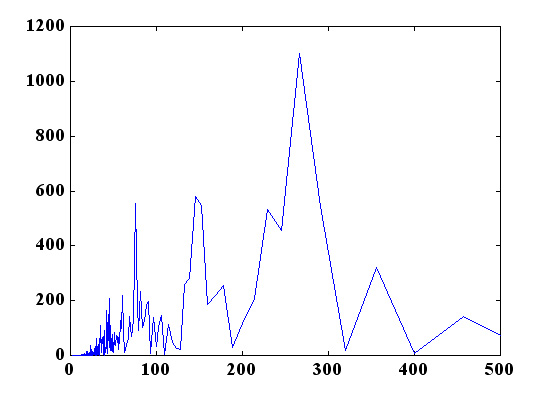
Figure 8 (bottom right). Periodogram showing spatial scales (meters) of CDOM surface excess patchiness.
BACK TO SCIMS PAGE