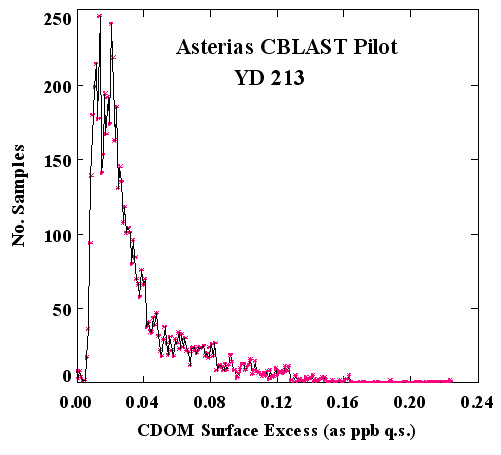
Figure 8 (top right). Histogram of CDOM surface excess.
BACK TO SCIMS PAGE