 |
Projects
A laboratory model of vertical ocean circulation driven by mixing
J.A. Whitehead and Wei Wang
Background
The ocean is composed of two different layers, a top warm layer
up to 1500 meters deep, centered in the tropics but extending
towards the poles. Below this is a deep thick layer of cold
water all the way to the bottom at roughly 5 km depth. What
governs the thickness of the upper layer and why does the bottom
layer cover the whole bottom including the tropics?
The sun heats the tropics and mid-latitudes. The heated water
is mixed downward by turbulence from wind-driven and tidal
currents. Polar regions receive less sunlight and the atmosphere
is much colder. The denser cold polar water sinks and spreads
laterally to cover the entire ocean floor, even in the tropics.
Gradually it mixes with the warmer water above and rises.
This completes a deep ocean circulation system comprised of
sinking in polar regions(large arrows), spreading of the deep
water to fill the deep ocean basins all over the world (medium
arrows), rising and warming in the equatorial and mid-latitudes
(smallest arrows), and a return to the poles to re-supply
the sinking water (not shown). This circulation produces a
sizeable portion of the equator-to-pole heat flux of the earth.
 |

|
| Figure
2. |
Experiment
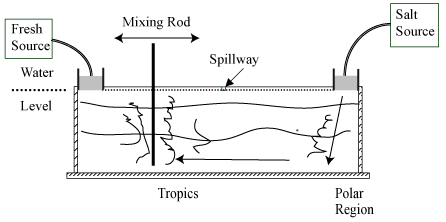
We made a laboratory model of this circulation that focuses
on the role of the turbulent mixing in a long narrow tank (122
cm long, 20 cm high and 5 cm wide). Instead of temperature,
the experiment pumps in fresh water at the left top end of the
tank (as a model of hot water) and denser salt-water at the
right top end (as a model of cold water) to change surface density.
A spillway in the middle maintains a constant volume in the
tank. With the tank filled with salt water, the waters are pumped
in gently and so a very shallow fresh water layer flows from
the source to the spillway at the surface and the dense salt
water fills almost the entire tank before leaving through the
spillway.
 |
| Figure
3. |
Then, we mixed the left side of the tank with a rod going back
and forth and waited for the flow to come to a steady balance.
The speed was fast enough to make turbulence. The velocity and
diameter (d) of the rod was selected to make the Reynolds number
where is water viscosity. Mixing took place in the left half
of the tank between the fresh water source and the spillway.
Density profiles were taken with a conductivity probe in the
right half.
Mixing made the fresh water layer become deeper. Also, there
was much more sinking and mixing under the salt water source.
A bottom current from the salt water end developed, and a
surface current from the fresh water end developed as shown
in the sketch.
The experiment and circulation is shown in this short video.
» View Video (.mov)
» View Video (.wmv)

|
| Figure
4. |
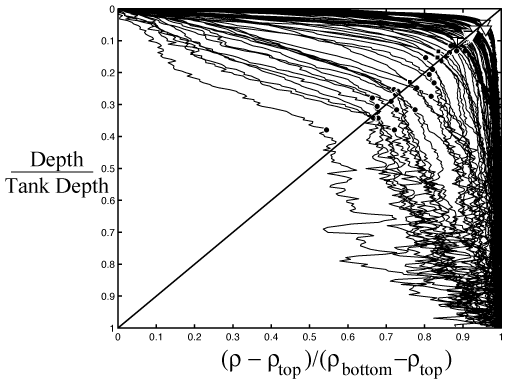
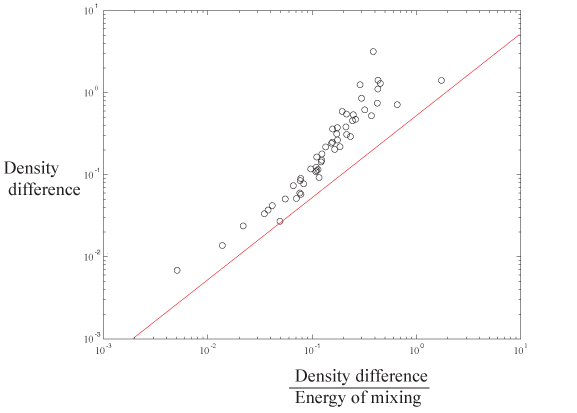
A large number of runs were conducted with different values of U, d, and rates of the fresh salt water pumps. Profiles of density (denoted by the greek letter rho) for many runs are shown here. The diagonal line indicates transition depths between upper and lower layers. The results have been plotted against a number of variables that are arranged in groups called dimensionless numbers. In this way, the results can be understood in the framework of fluid mechanics, so that the results apply equally well in the laboratory or in the ocean. The data show, for example that the density difference between the top and bottom of each upper layer clusters systematically with a dimensionless number inversely proportional to mixing intensity.

|
| Figure
5. |
The detailed results are not shown here, but the mechanics and
interpretation of the energy balance are reported in the Preprint: A laboratory model of vertical ocean circulation driven by mixing (pdf)
One simple basic result can be used to understand the ocean more clearly. It was unexpected, although it is relatively simple to visualize now that it is understood. We defined a value of potential energy stored in the salinity field. When the experiment is running steadily, the potential energy is constant. The entering salt water sinks to the bottom in a turbulent plume, thus decreasing the potential energy. Meanwhile, the turbulent stirring lifts salty water lying near the bottom upward, increasing the potential energy. Therefore, the potential energy gained from mixing exactly equals the energy lost by sinking.
We speculate that the same is true in the ocean, and suggest that the rate of decrease of potential energy in polar regions from sinking of cold dense water equals the rate of potential energy gain all over the oceans from mixing. The flux rates of the sinking currents have been measured, but all the mixing in the oceans is only documented in a few locations so far; therefore, a quantification (rather than an estimate) of total ocean mixing is not yet feasible. Naturally, the actual ocean has a variety of additional complications such as a nonlinear equation of state, heating from below from inside the earth, density changes due to both temperature and salinity variations so that altogether a full documentation of the energy budgets is quite involved. Present-day estimates of fluxes of potential energy are not known with enough precision to determine the rates of change of flux rates, but the overall ocean potential energy of the ocean does have a detectible drift since mean ocean temperature is reported to have changed slightly over the past decade. Therefore, budgets of energy conversion might be fruitfully measured and studied to clarify the complete energy cycle of deep ocean circulation.
|
|

