
Multimedia Items
Climate Hero: The Ocean’s Super-Powered Carbon Pump
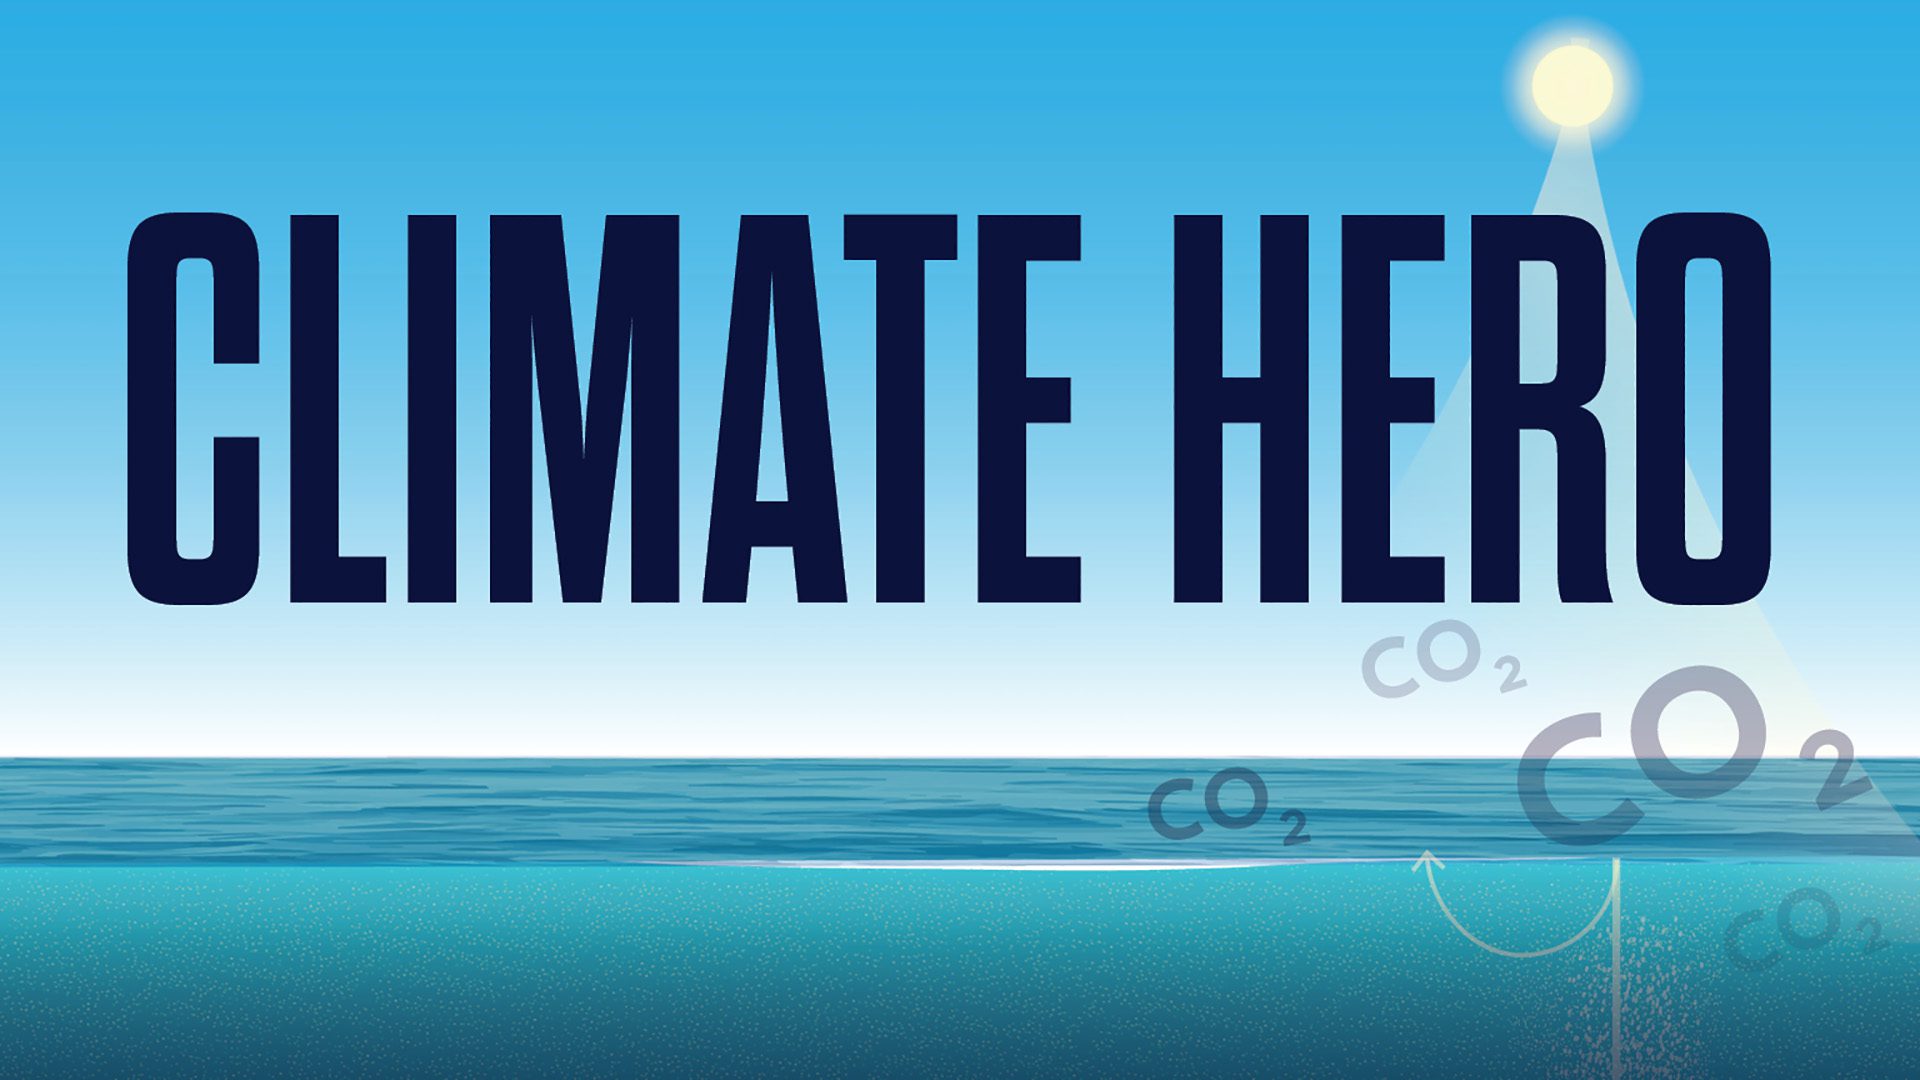
Learn about the biological carbon pump—the living ocean’s role in moving carbon out of the atmosphere and into the depths.
Read MoreSonic Seas: Using Sound to Understand and Conserve the Ocean

Experts discuss the many ways that ocean life uses sound and what those sounds can tell us about biodiversity, health, and our impacts to marine ecosystems.
Read MoreOcean Encounters: Titanic and Beyond

Join us to hear how eyes in the deep have changed our view of the ocean—and meet one of the first people to spot the Titanic on the seafloor!
Read MoreOcean Encounters: An Ocean of Sound
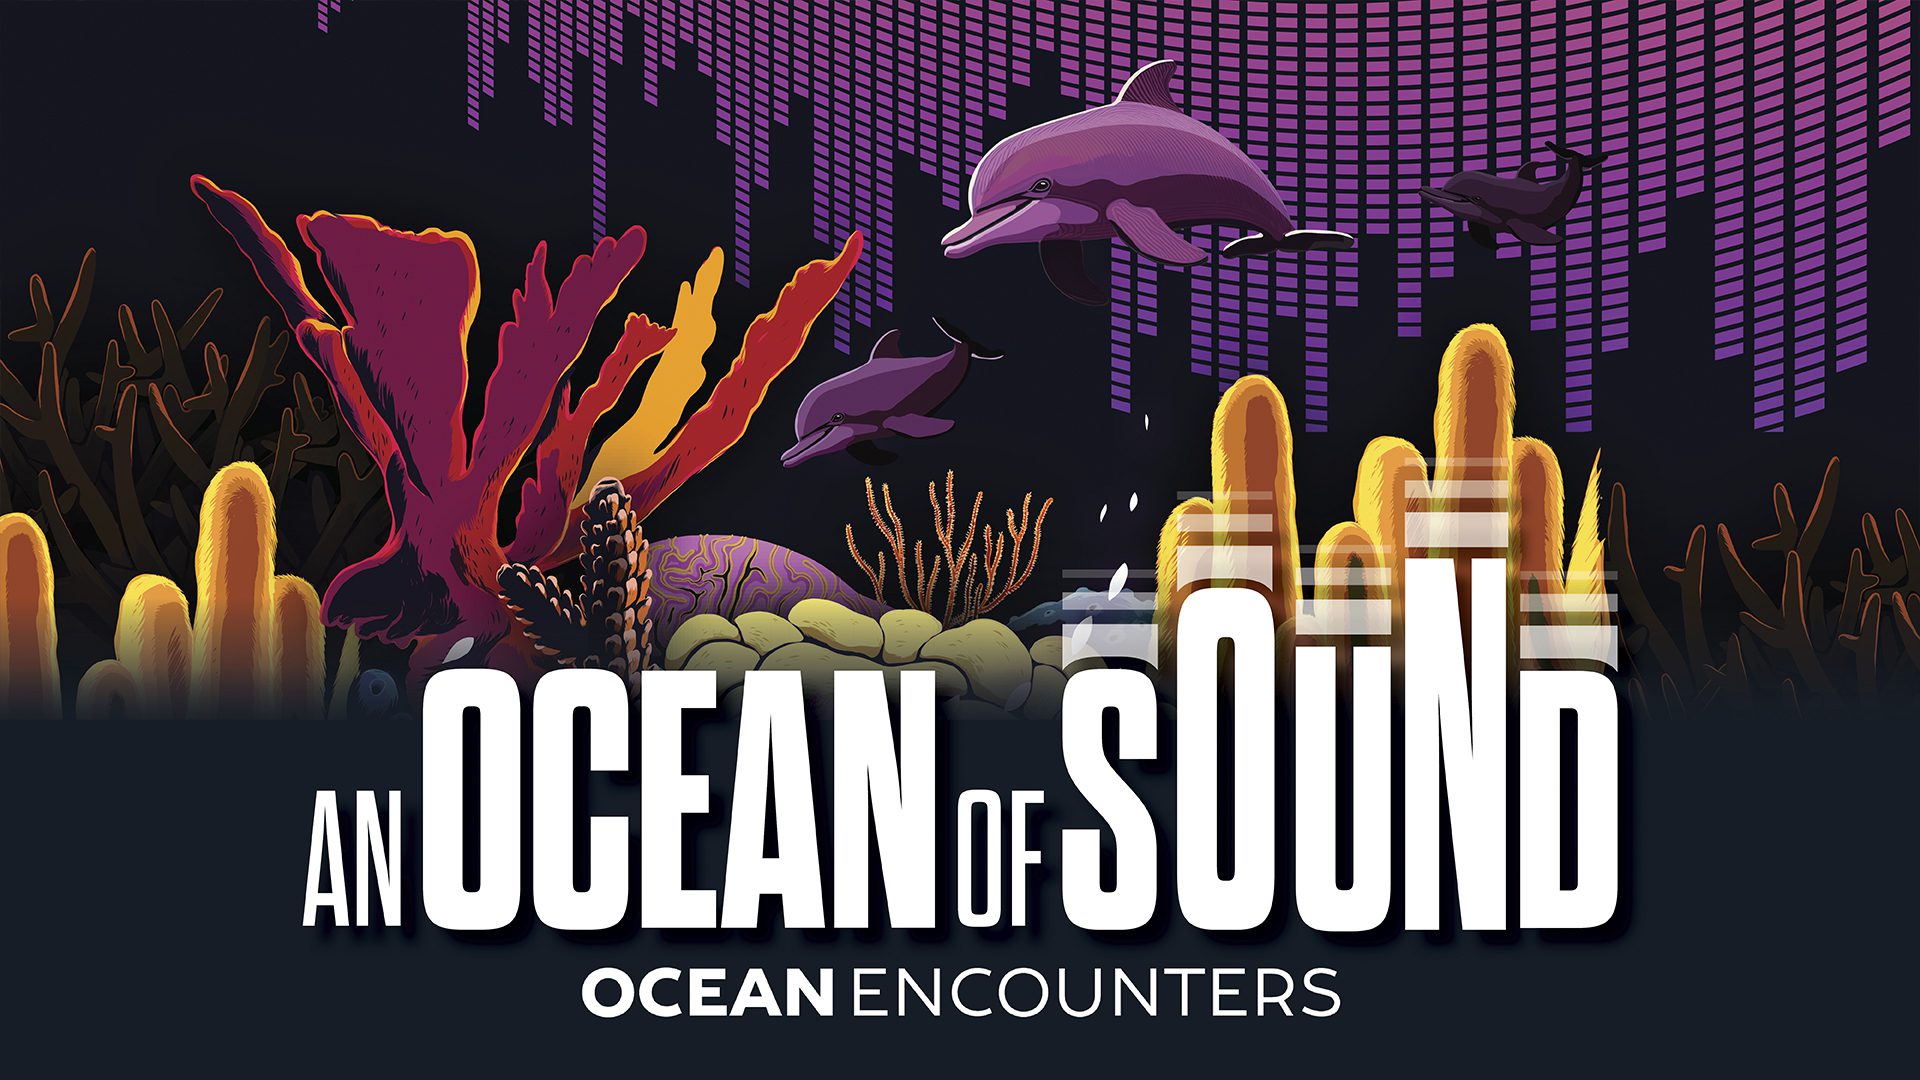
The ocean is awash with a complex symphony of sound, where the clicks, grunts, and whistles of marine life compete with the rumbles, whirs, and thuds of natural and human activity. Join us to learn how biologists are working to decipher animal communication, and use sound to protect ocean life and even restore degraded habitats.
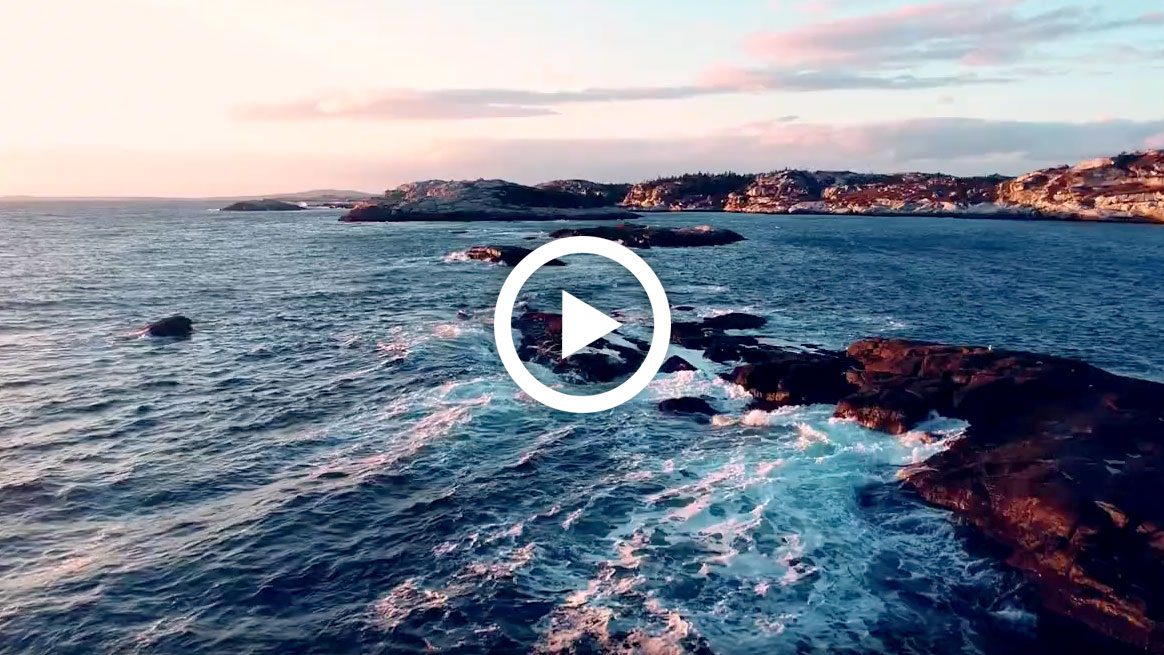
Read MoreOcean Encounters: Cities and the Sea
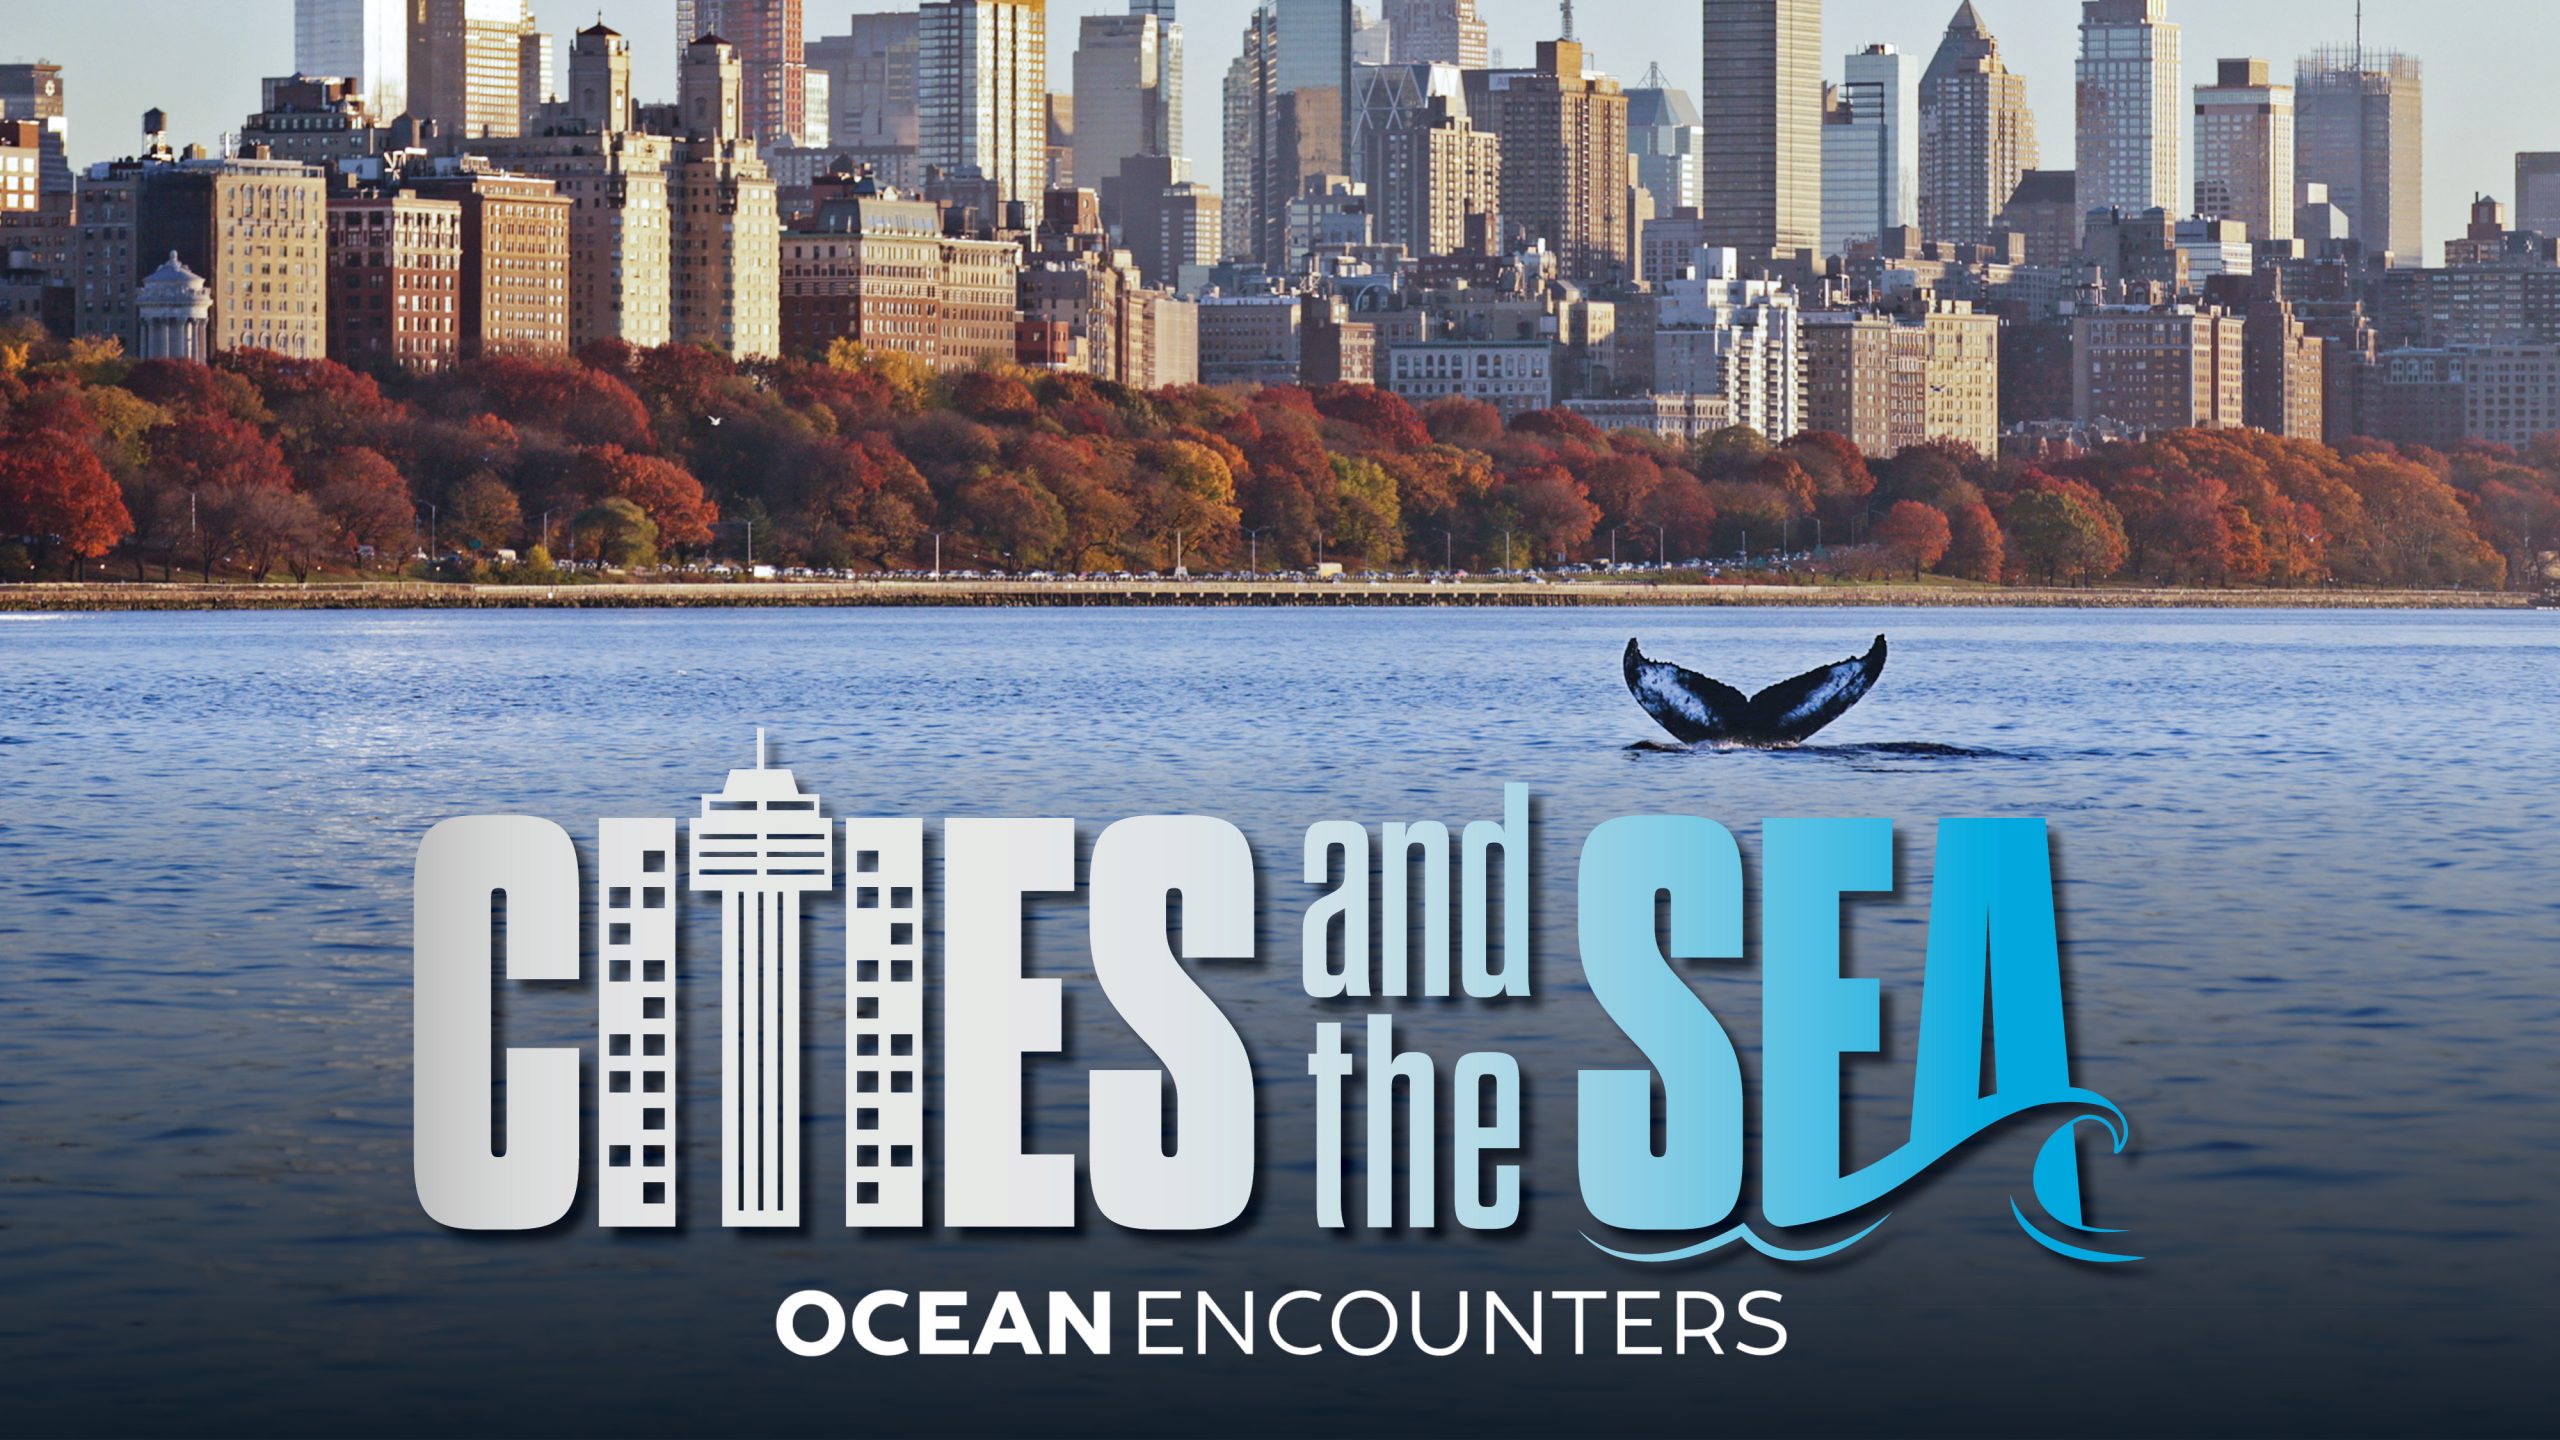
Join us as we explore impacts, adaptations, and new possibilities in urban ocean regions around the world.
Read MoreOcean Encounters: Ice!
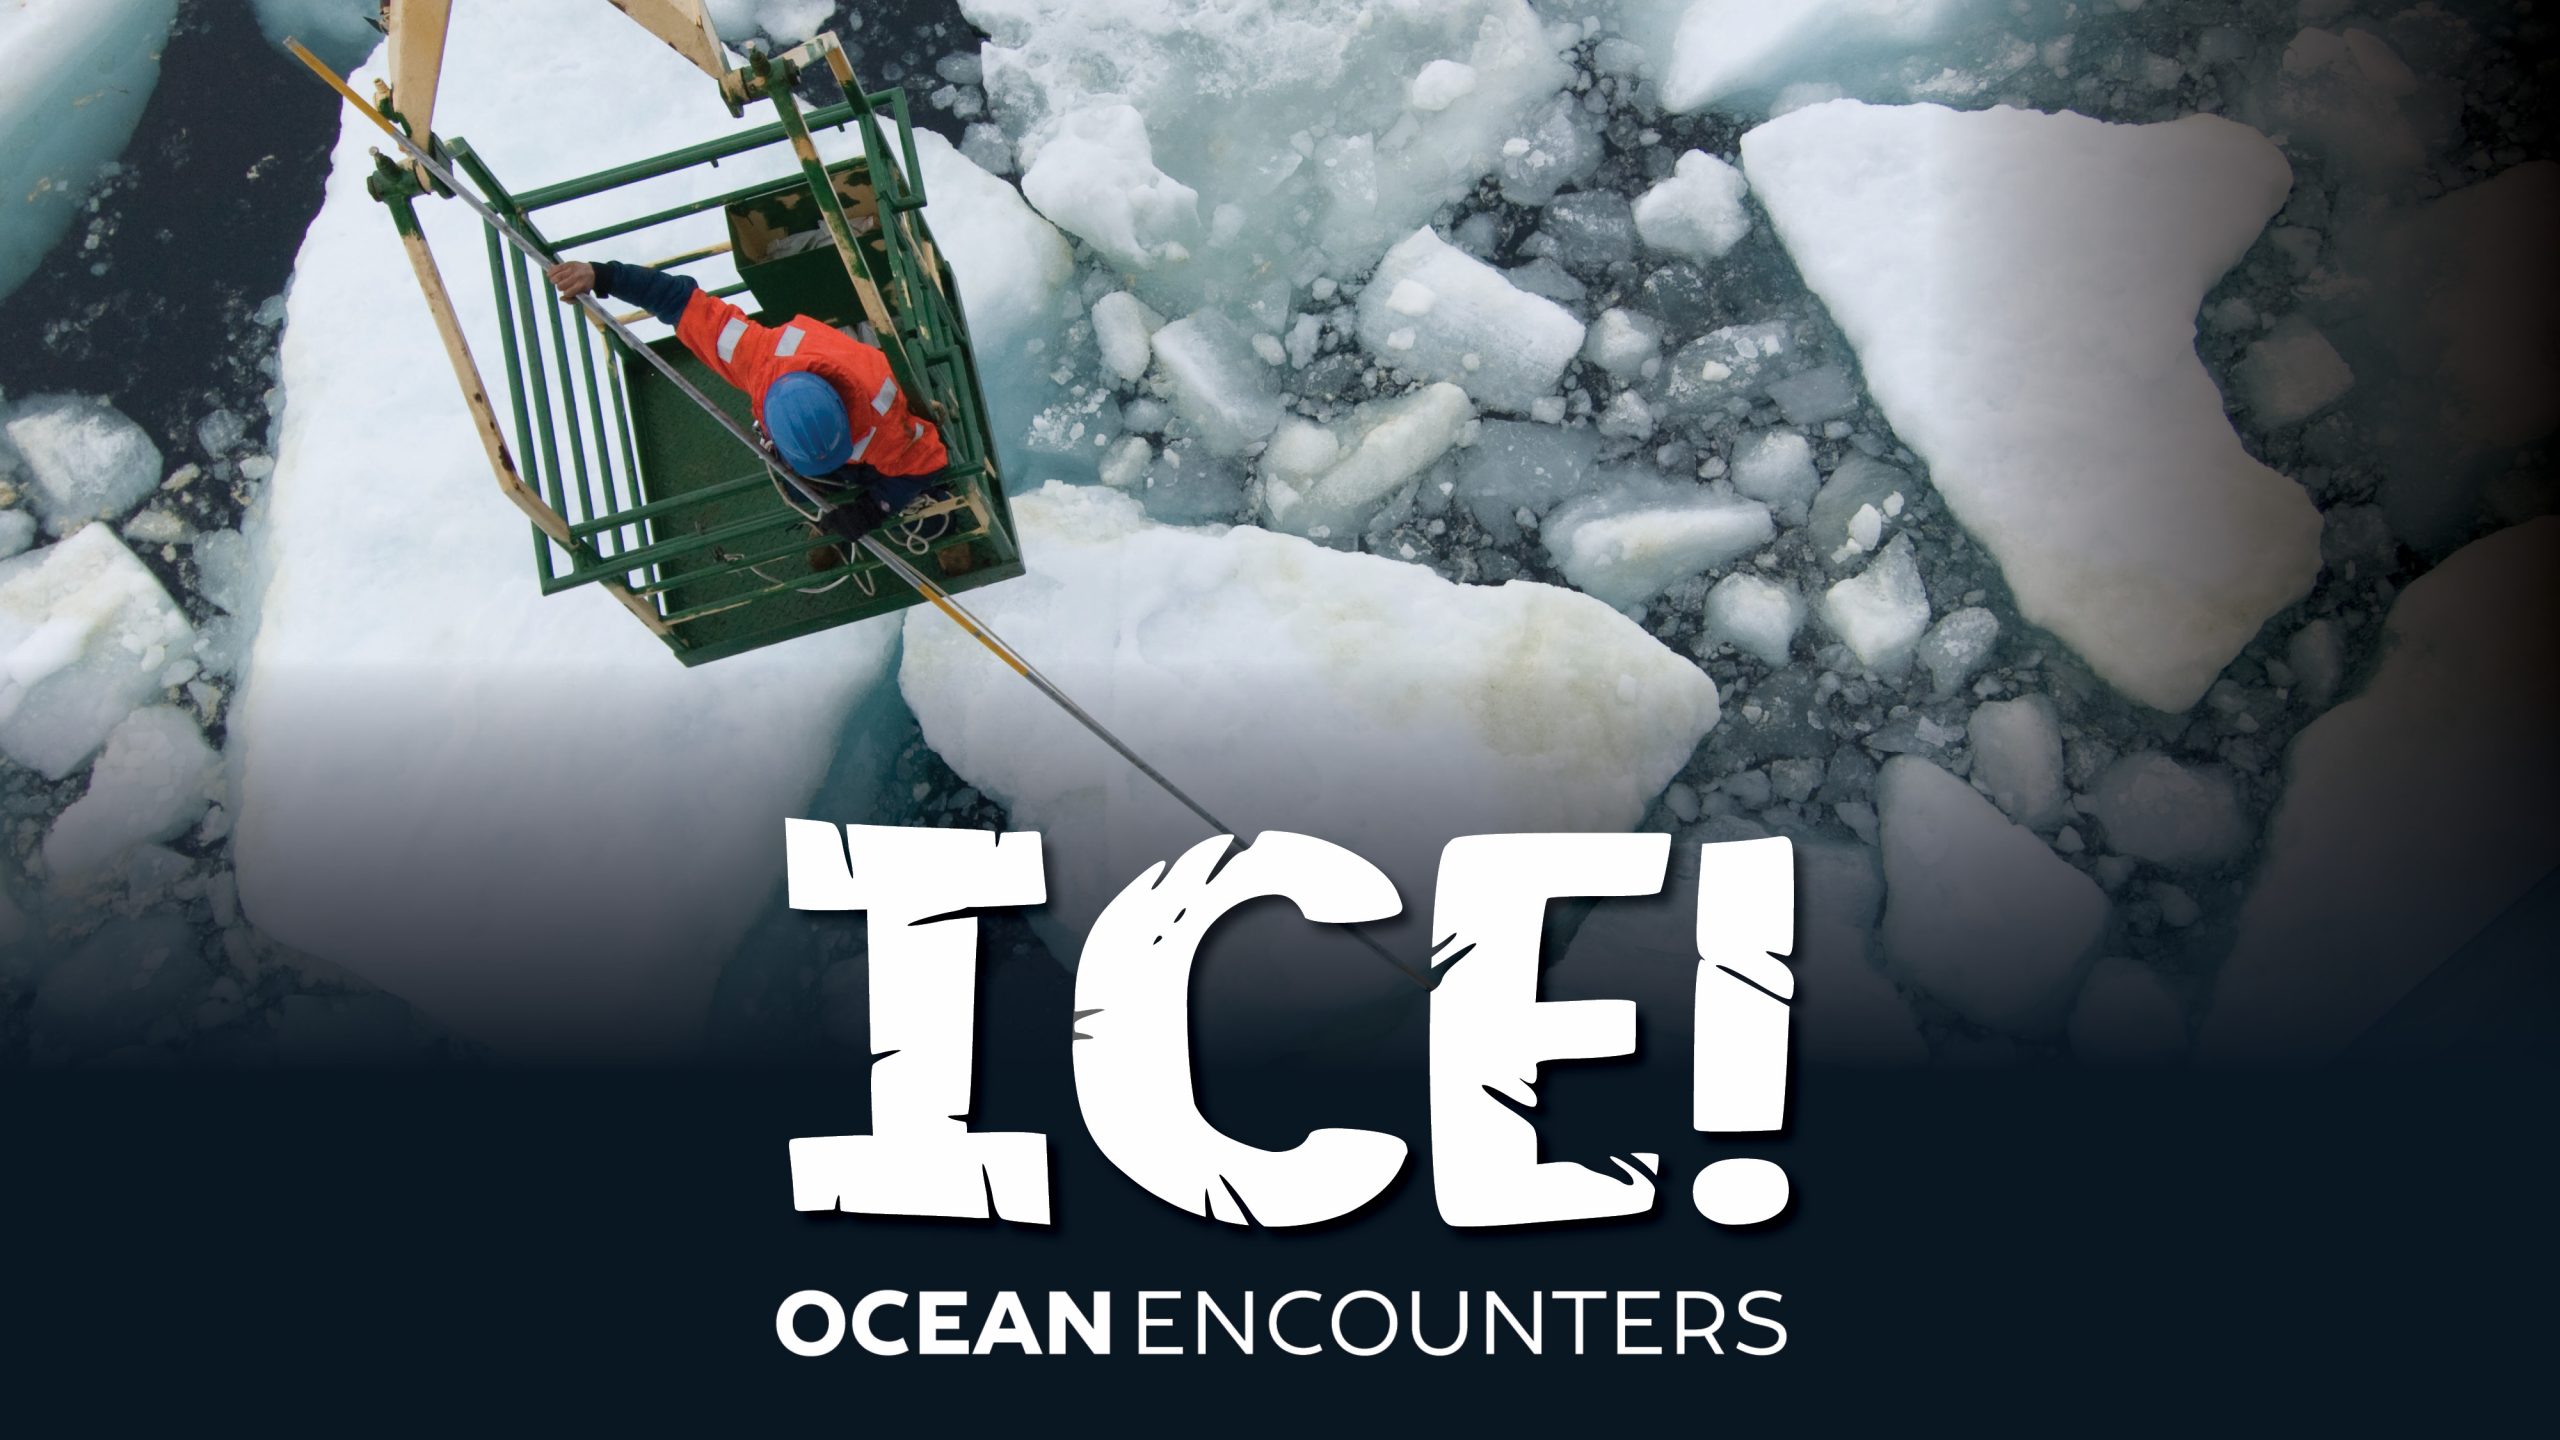
Insights from frozen frontiers on Earth and beyond Frozen landscapes have captivated imaginations for generations.
But what kinds of life can survive in these harsh environments? What can ice tell us about Earth’s past—and future? And what could we discover by peering beneath the thick, icy surface of ocean worlds elsewhere in our solar system? Join three WHOI researchers as we explore these questions and more!
Read MoreCan multivitamins help save coral reefs?
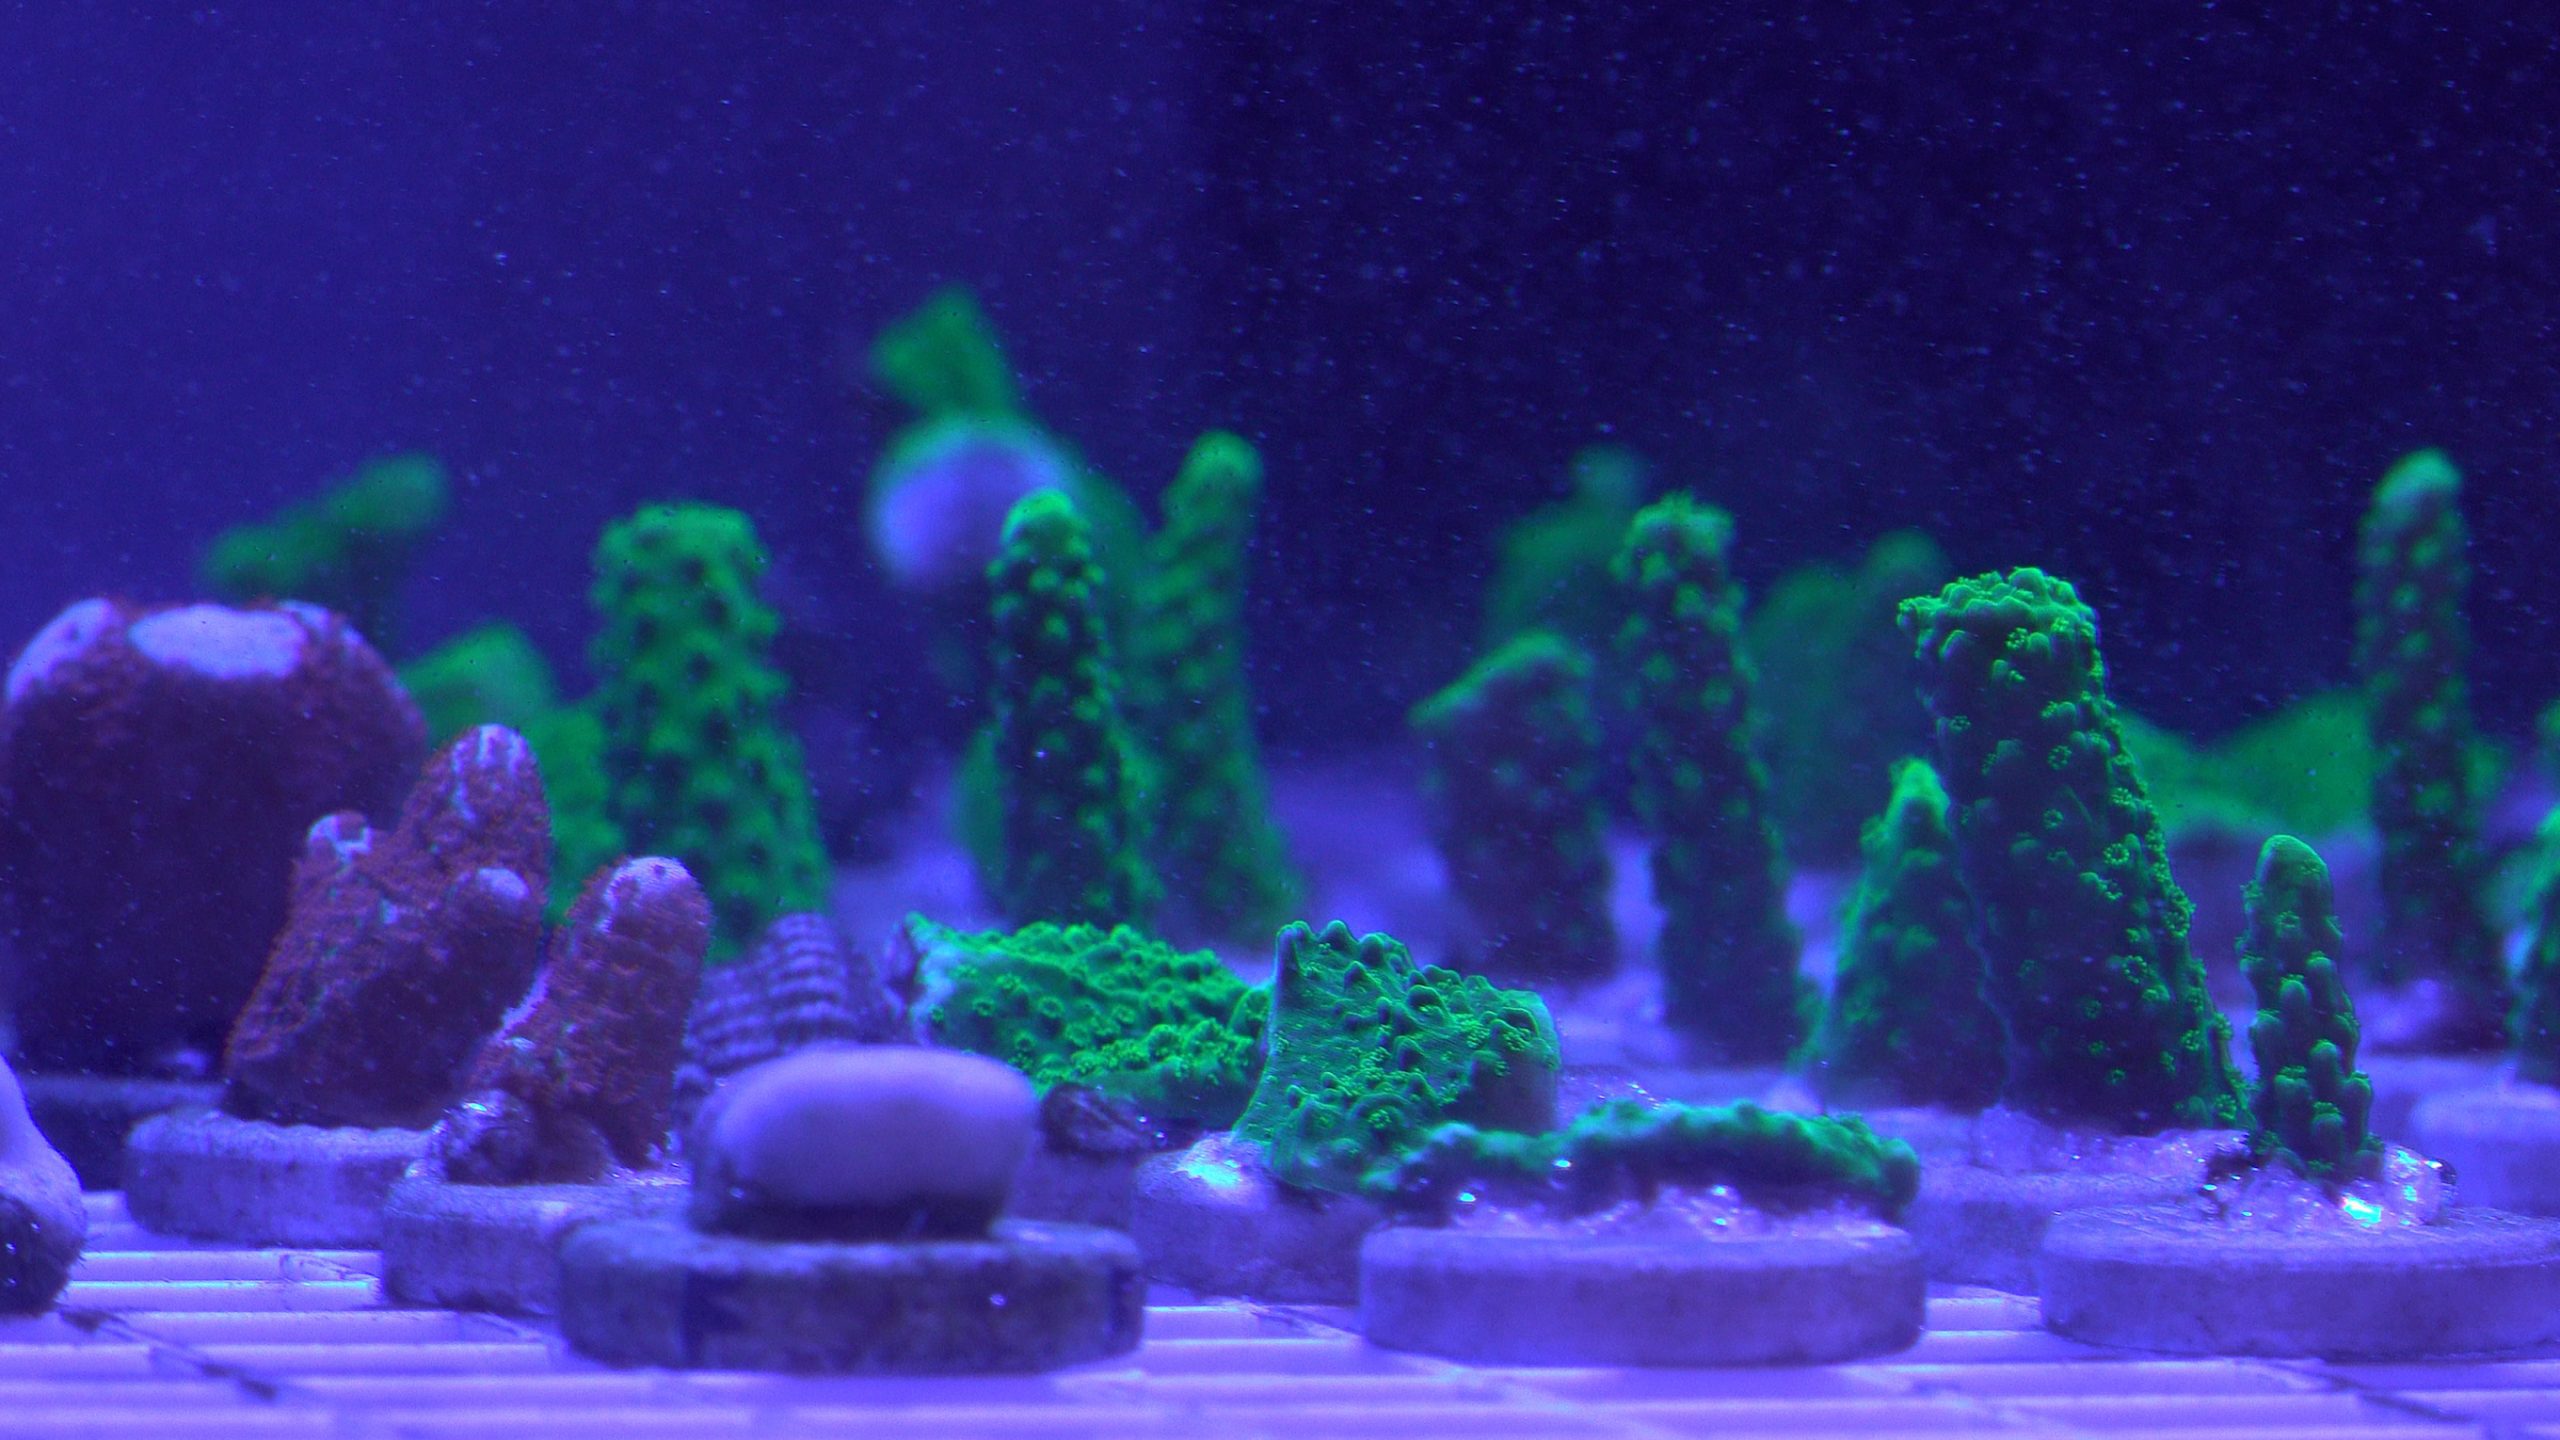
💊🪸Could a multivitamin help save coral reefs? Preliminary data says… yes! Like humans, these marine ecosystems rely on nutrients in the environment surrounding them. WHOI Reef Solutions experts have…
Read MoreWhat is the biological carbon pump?
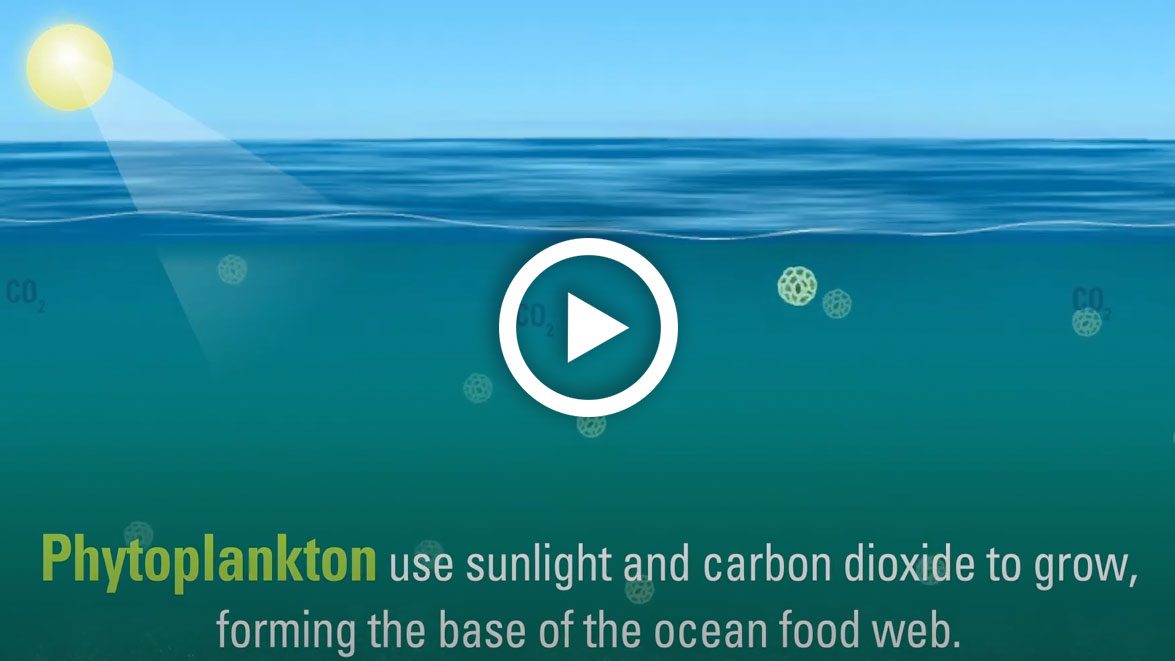
Scientists have long known that the ocean plays an essential role in capturing carbon from the atmosphere, but a study from Woods Hole Oceanographic Institution (WHOI) shows that the efficiency…
Read MoreRepresenting the Ocean at COP29

WHOI & Scripps convene the Ocean Pavilion for a third year at the UN climate conference.
Read MoreHow does the ocean produce oxygen?
It’s easy to think of the world’s forests as the planet’s “lungs.” Trees pump out oxygen—the same stuff we breathe in. The bigger the tree the more oxygen it releases.…
Read MoreWhat makes the ocean salty?
If you go swimming in a lake, the water is fresh; when you dive into the ocean, it tastes salty. But why? Learn more: https://www.whoi.edu/know-your-ocean/did-you-know/what-makes-the-ocean-salty/
Read MoreWhy is the ocean blue?
Why is the ocean blue? People have wondered this for hundreds of years. Learn more: https://www.whoi.edu/know-your-ocean/did-you-know/why-is-the-ocean-blue/
Read MoreHow is beach sand created
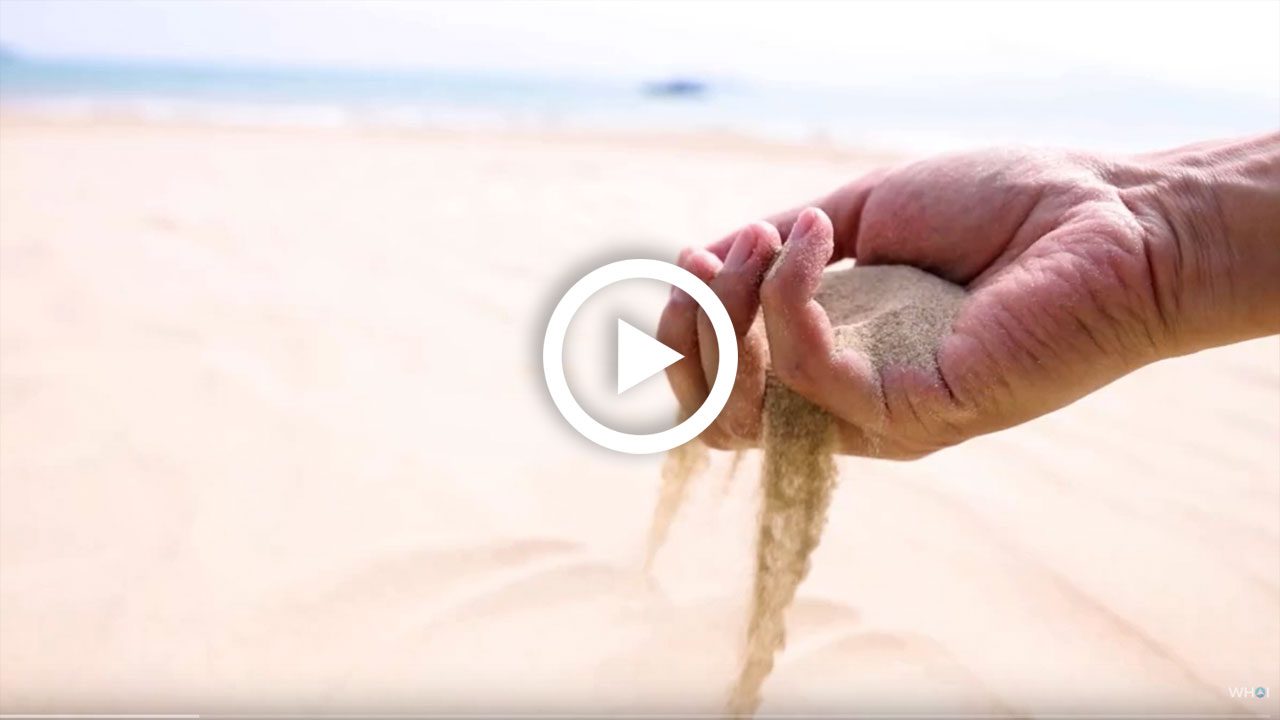
The sands of many tropical islands are snow white. Beaches in Hawaii can be white, black, green, or red. In Bermuda, sand is often pink. And most of the world’s…
Read MoreHow are seashells made?
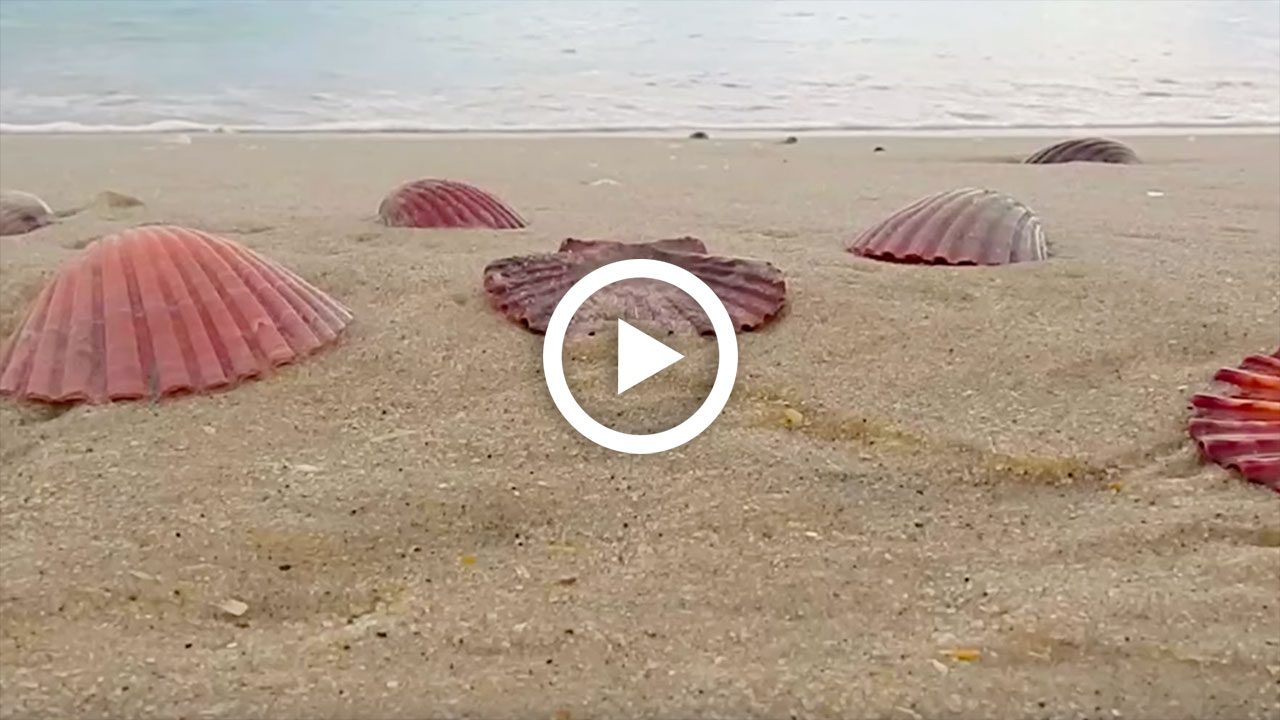
One of the most striking features of our beaches is seashells but, where do shells come from and how are they made? Learn more: https://www.whoi.edu/know-your-ocean/did-you-know/how-are-seashells-made/
Read MoreOcean Encounters: Geology Rocks!

Join us as we talk with three people with very different jobs—all in geology—about how they got into the field and where their careers are taking them.
Read MoreAsking ocean explorers deep questions

WHOI deep-sea experts join NOAA Ocean Exploration in this webinar for middle school students
Read MoreOcean Encounters: Restless Seas
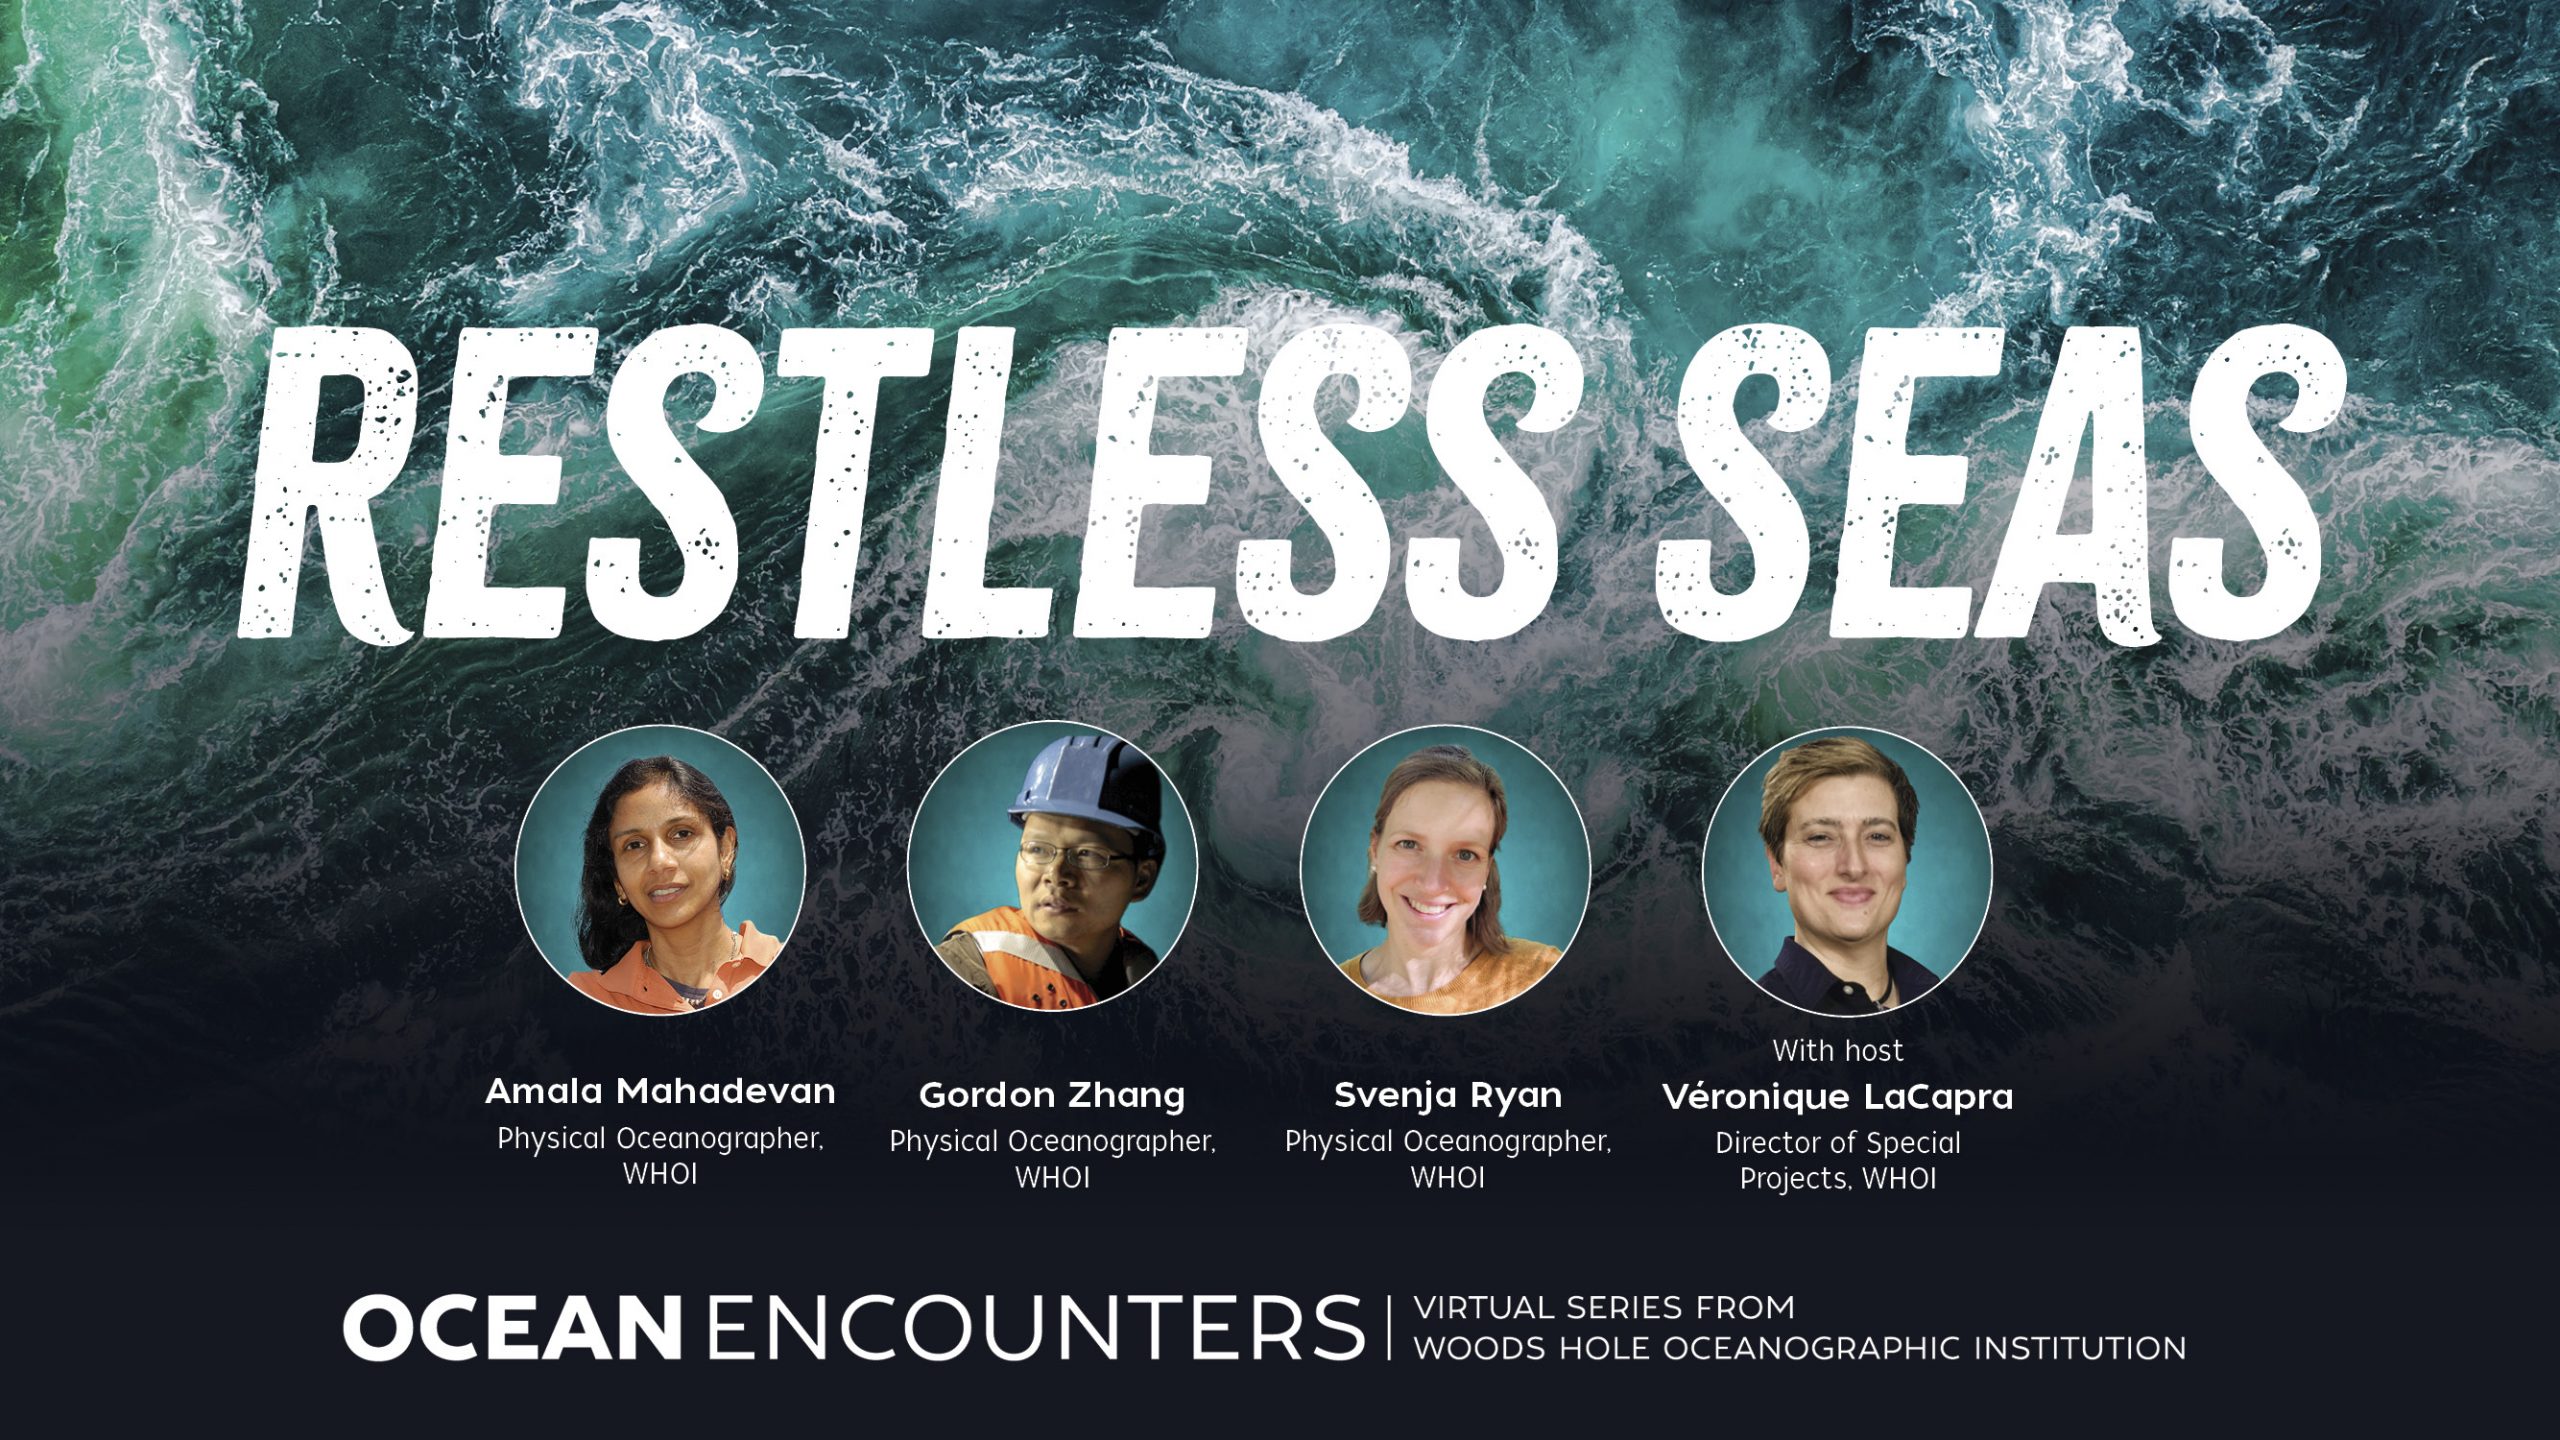
Join three WHOI scientists for a discussion about ocean currents, how they are changing, and the implications for marine life and all of us.
Read MoreWhat’s for dinner, deep-sea isopod?
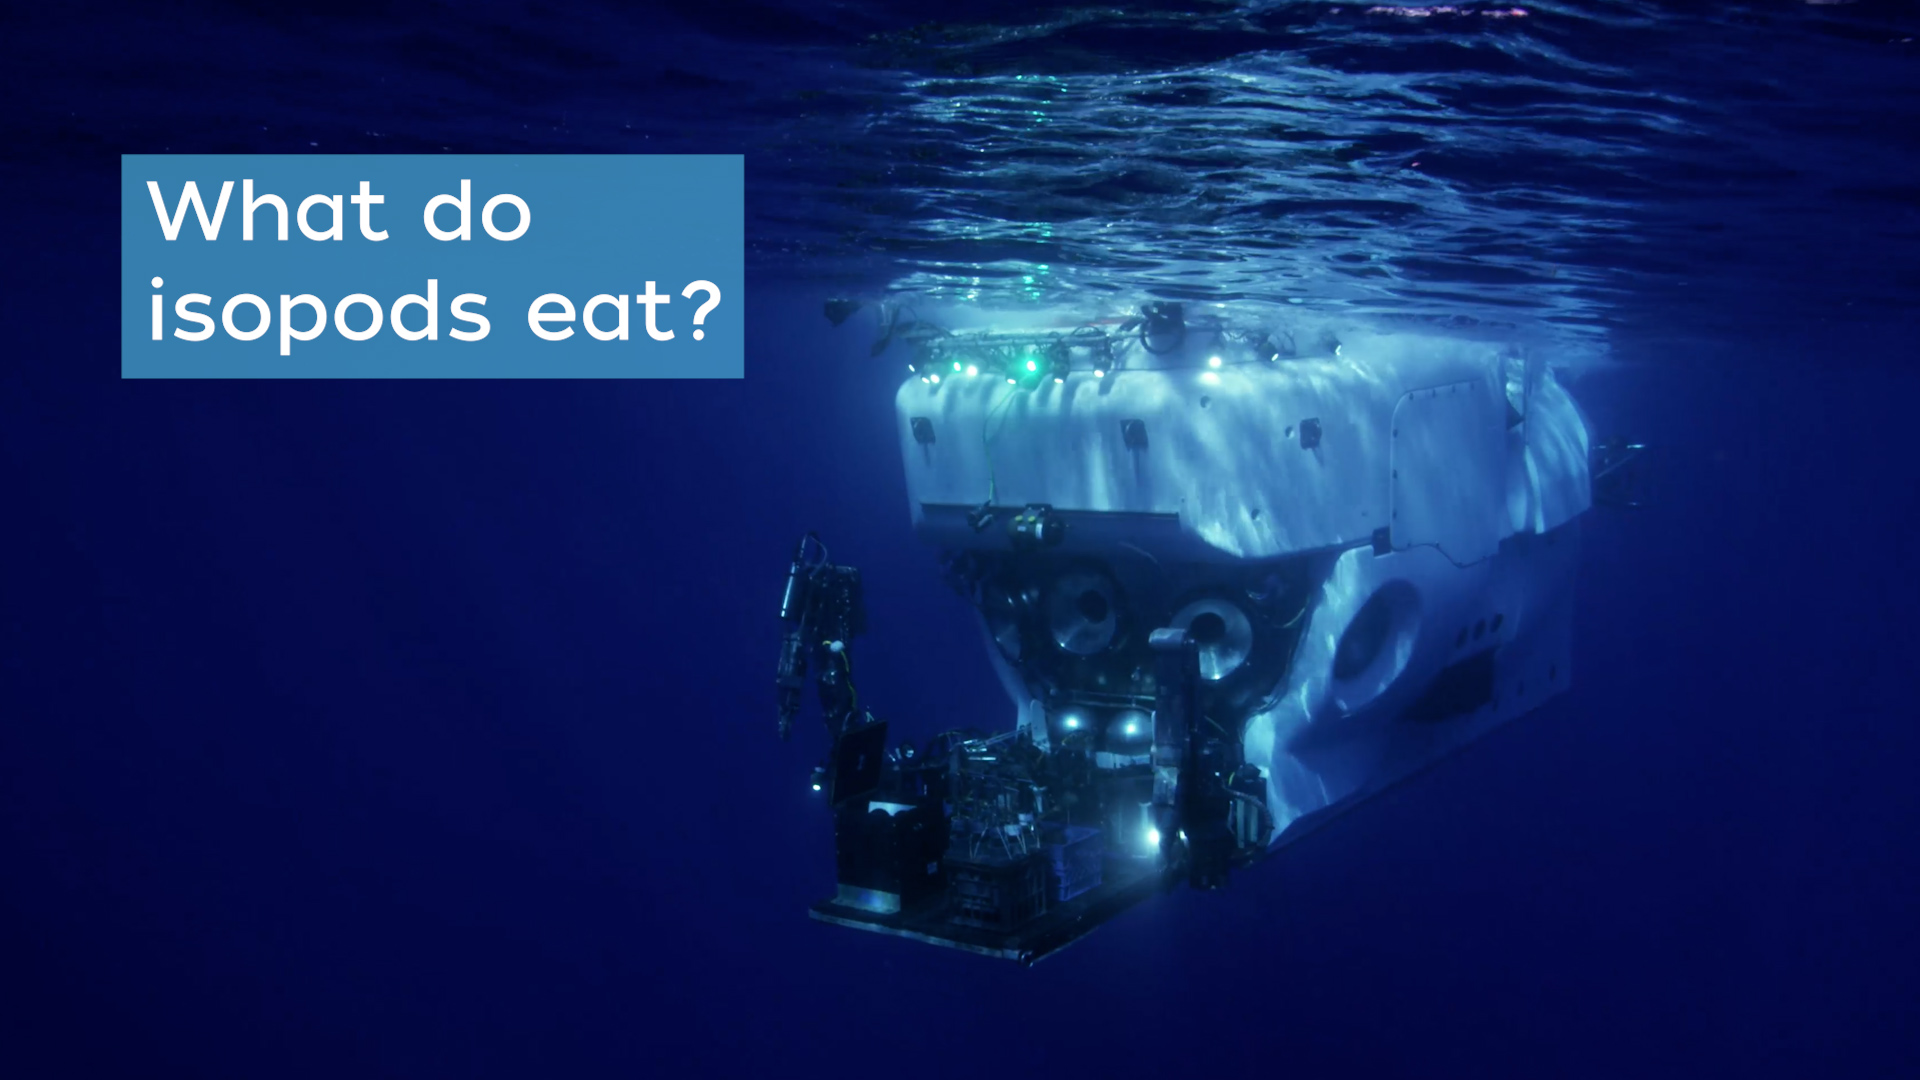
Four miles below the surface, scientists in #Alvin witnessed this rarely-seen invertebrate paddling along with oar-like legs in search of its next meal. In a recently-published study, #WHOI researchers share another surprise: that seaweed they’re munching on isn’t native to the seafloor!
📲 Find out what it is– and how this species has adapted over time: go.whoi.edu/isopod-food
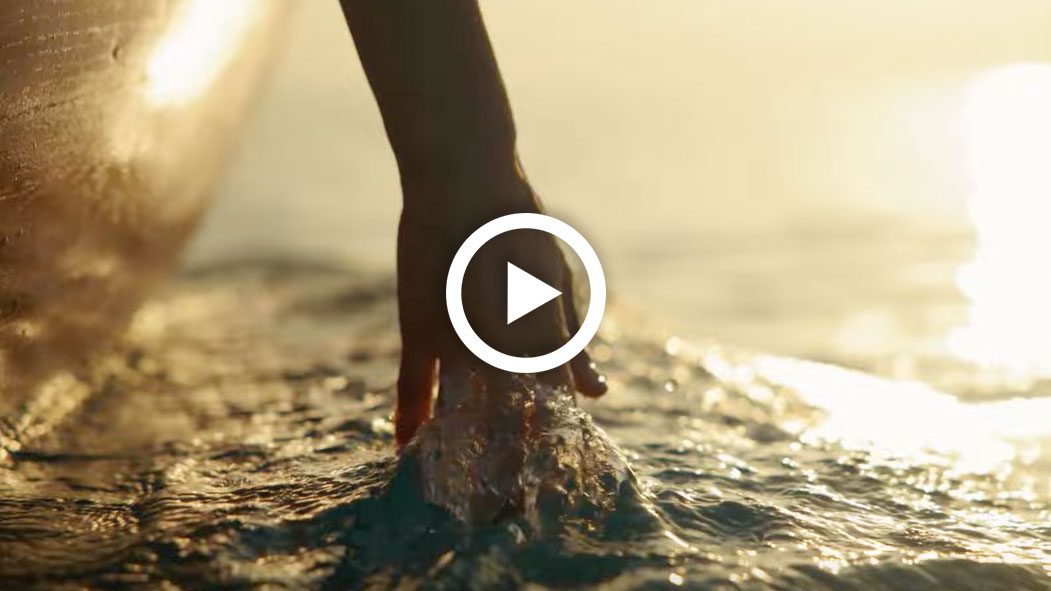
Read MoreWhat does living ocean mean to you?

WHOI staff tackle a tough question about life in the big blue
Read MoreEvaluating Ocean Climate Solutions
In case you missed it, watch the WHOI public information session on marine carbon dioxide removal and the LOC-NESS Project
Read MoreBoundary of Creation: A Report on Project FAMOUS
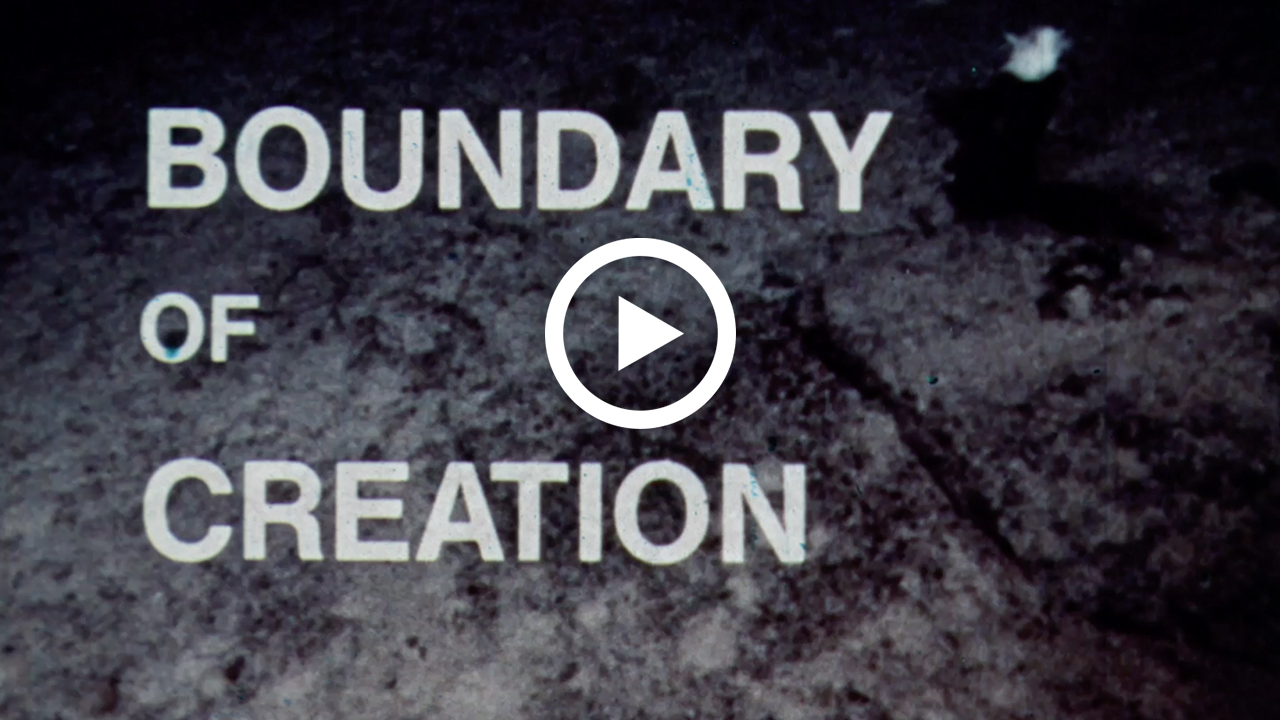
Celebrate 60 years of Alvin with an inside look at the global mission to map the Mid-Atlantic Ridge
Read MoreThe Biological Pump
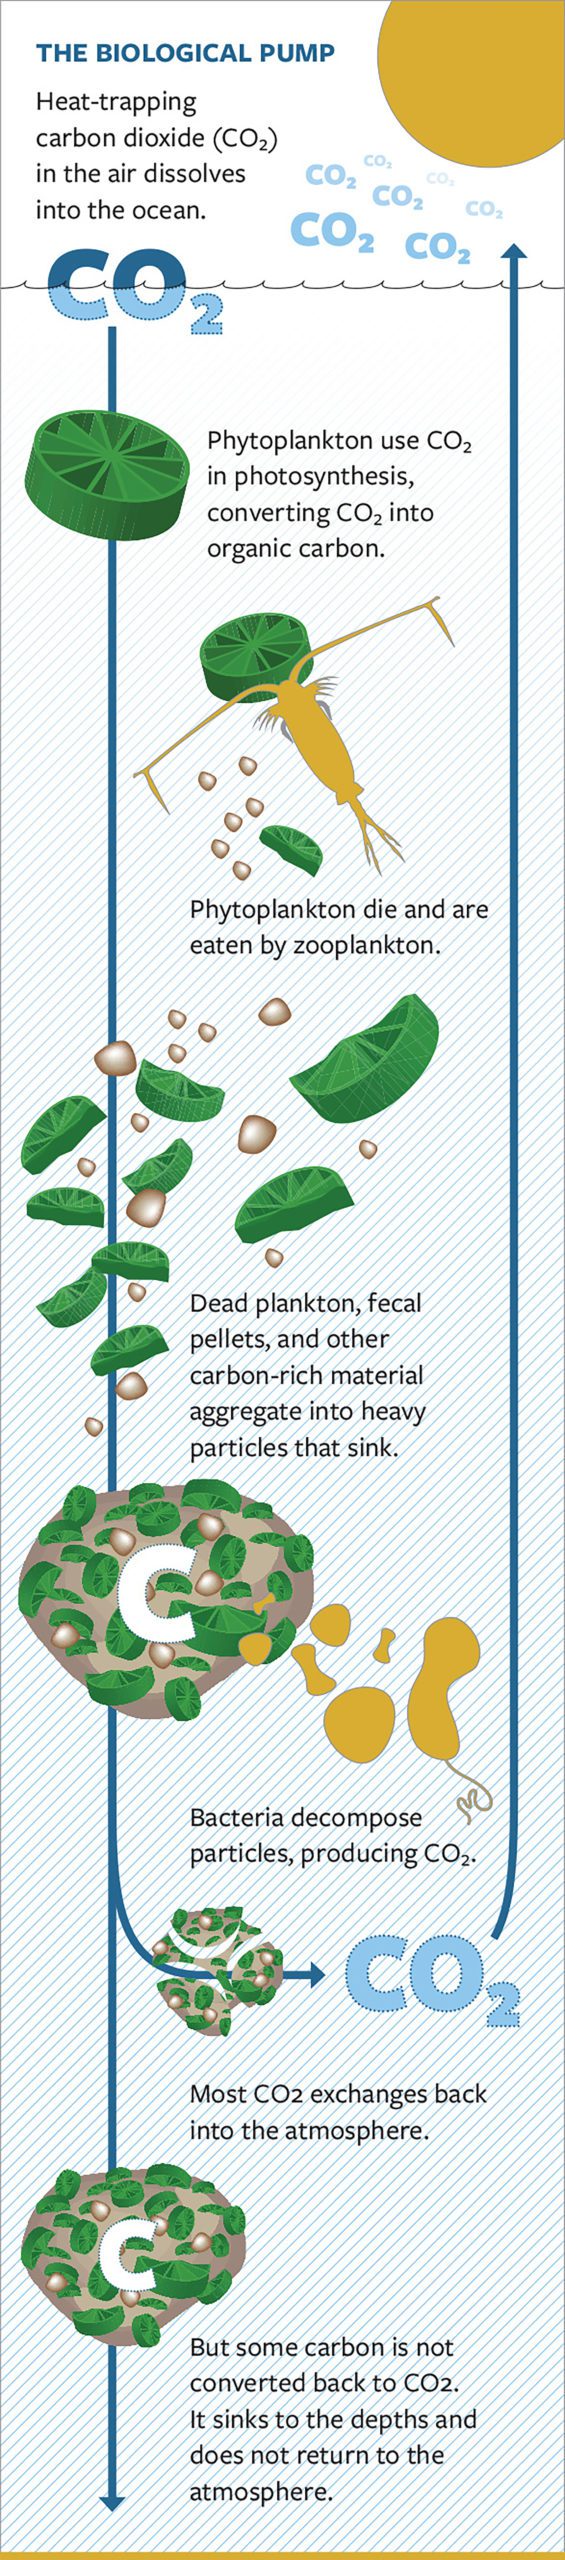
Used in Oceanus magazine, Vol. 54, No. 1, pg. 19. (Illustration by Eric S. Taylor, © Woods Hole Oceanographic Institution)
Read MoreRadioisotopes Tracking Tuna Migration
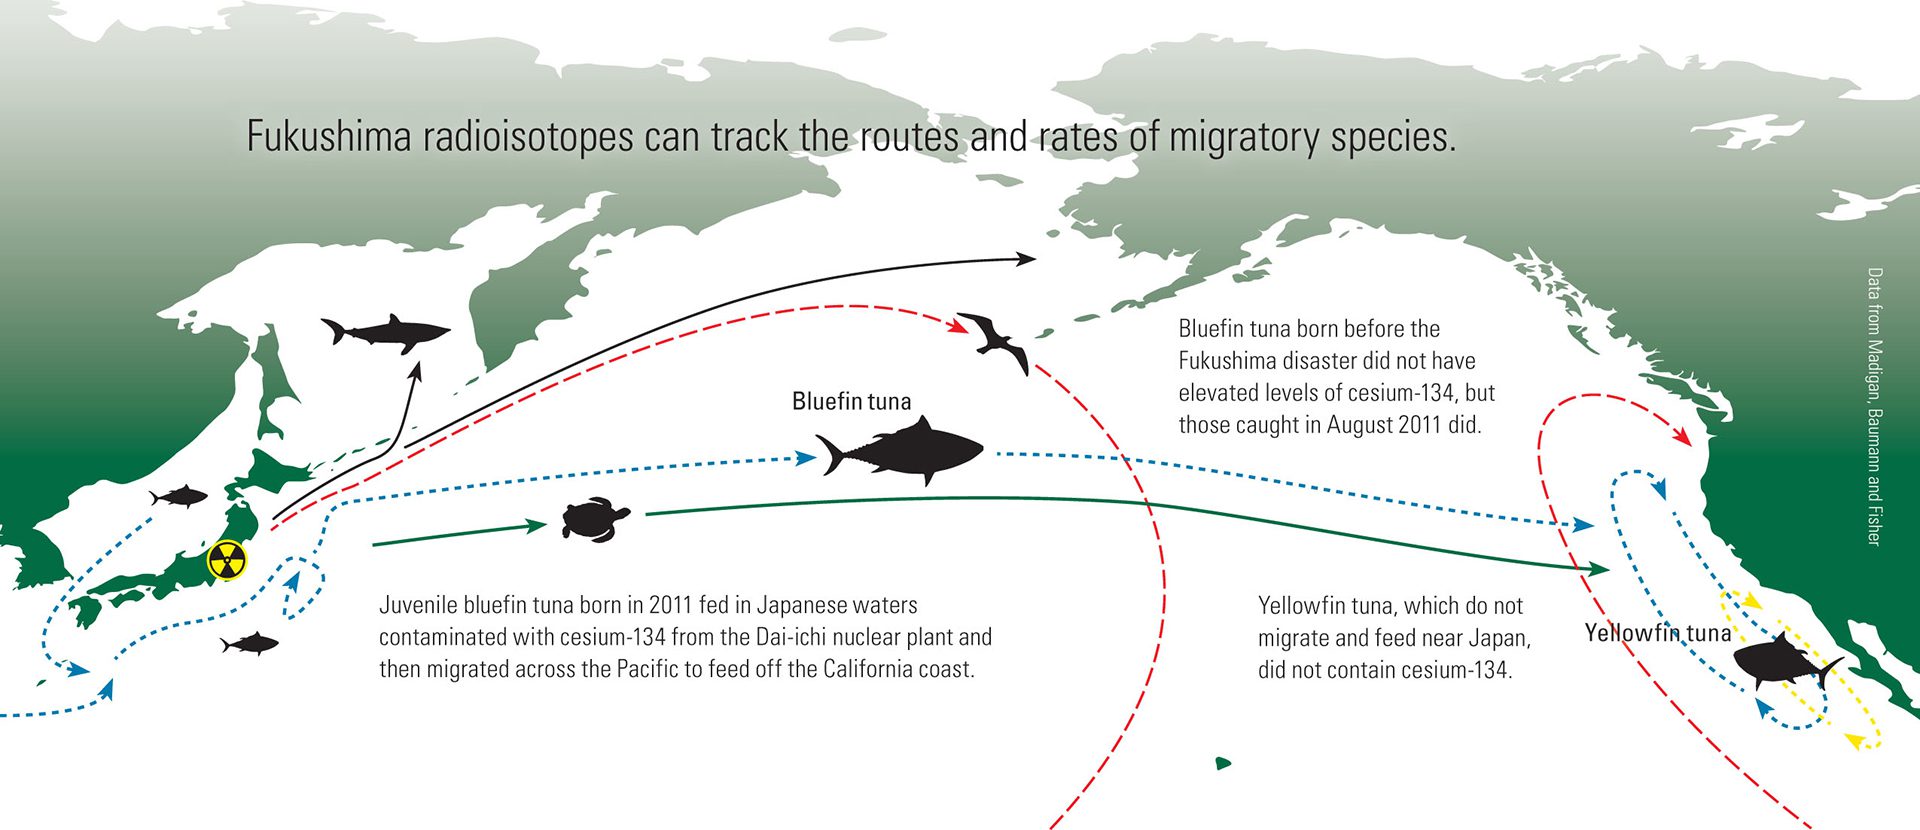
Infographic showing radioisotopes tracking tuna migration. (Illustration by Eric S. Taylor, © Woods Hole Oceanographic Institution)
Read MoreHow subterranean water seeps into the continental shelf and into the ocean
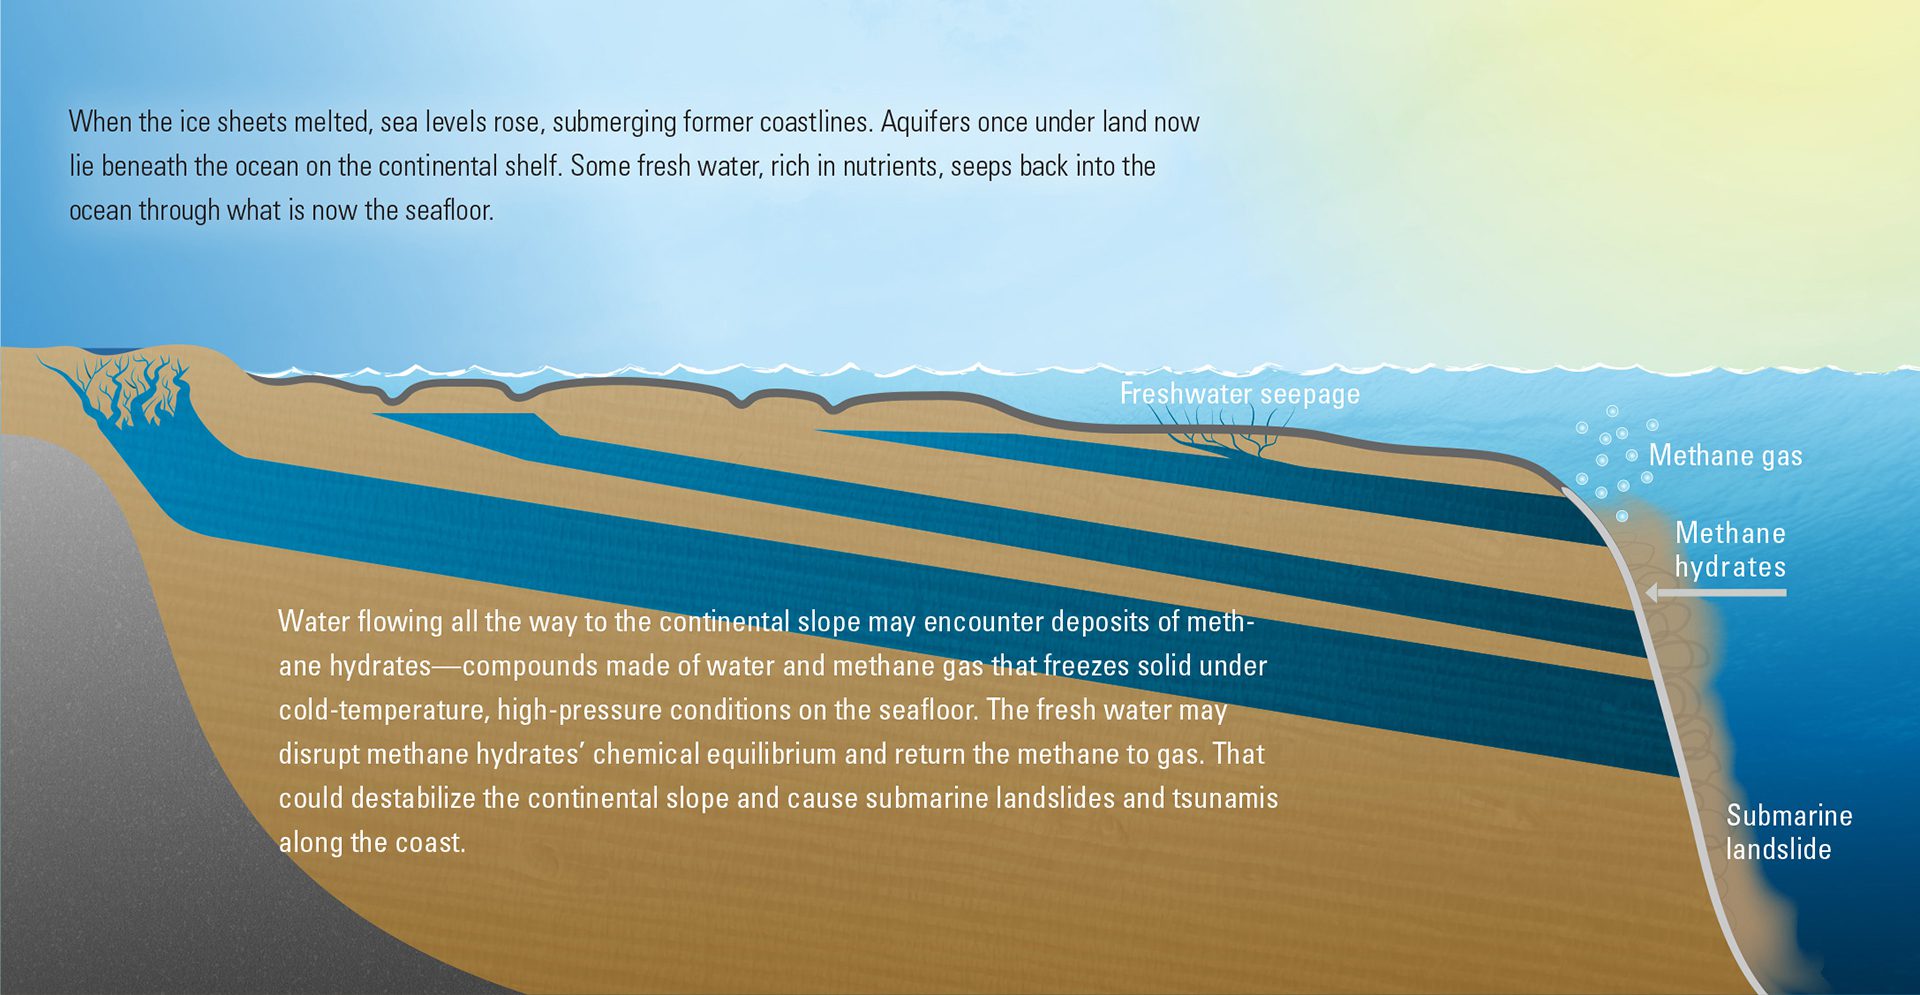
How subterranean water seeps into the continental shelf and into the ocean. (Illustration by Eric S. Taylor, © Woods Hole Oceanographic Institution)
Read More