
Sound waves data plot
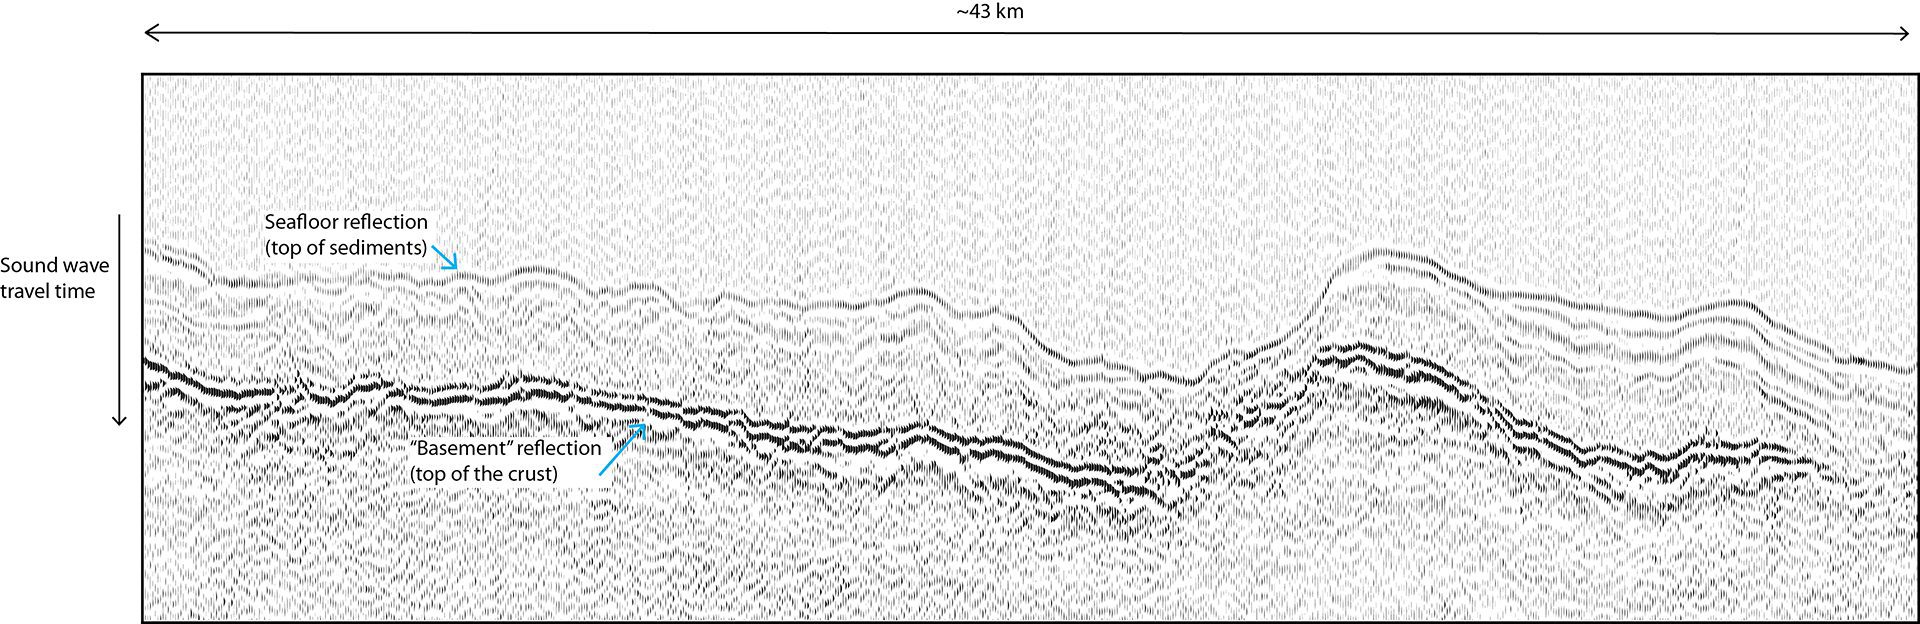
This image was created using sound waves that traveled through the ocean, through the seafloor, and back up to recorders trailing a ship on the surface. By measuring the time it takes for the sound waves to return, scientists can detect different layers of rocks and sedimentsin this case, the top of the seafloor crust and the layer of sediments lying on top of it. (Hannah Mark, WHOI, with data from the Incorporated Research Institutions for Seismology, © Woods Hole Oceanographic Institution)
Image and Visual Licensing
WHOI copyright digital assets (stills and video) contained on this website can be licensed for non-commercial use upon request and approval. Please contact WHOI Digital Assets at images@whoi.edu or (508) 289-2647.