Understanding the Melting Arctic
WHOI Scientist Sarah Das on the unprecedented melting of the Greenland ice sheet
By Madeline Drexler | January 16, 2020

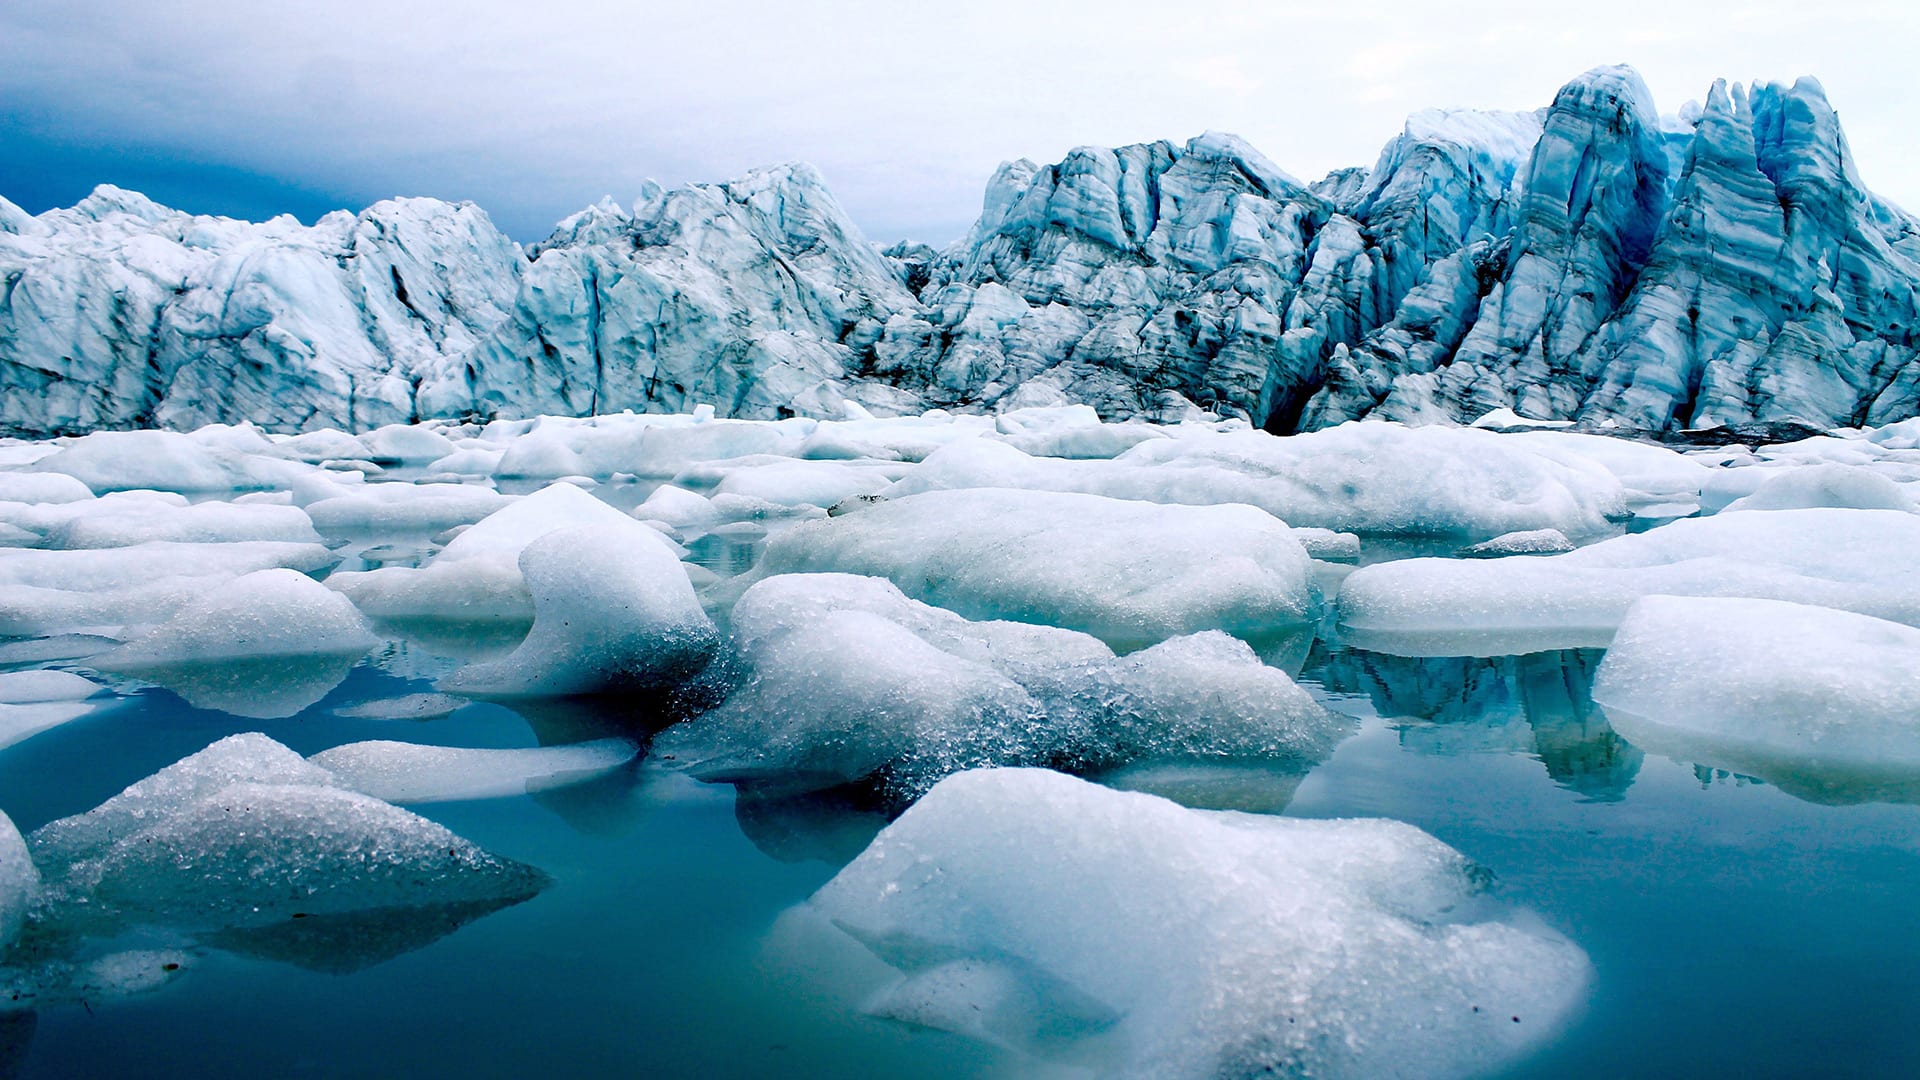
On August 1, 2019, during the tail end of an intense heat wave over Europe, the Greenland ice sheet experienced its biggest one-day melt in recorded history, spewing 12.5 billion tons of water into the sea—enough to fill 5 million Olympic-sized swimming pools.
The news headlines didn’t surprise glaciologist Sarah Das. She focuses on the cryosphere—the frozen water part of the earth’s surface. Today, the Arctic is one of the regions most sensitive to climate change, with air temperatures rising faster than anywhere else on the planet.
In December 2018, Das and her colleagues published a study showing that surface melting and runoff across Greenland’s mile-thick ice sheet started increasing in the mid-19th century—the dawn of the Industrial era, when humans began burning coal, oil, and natural gas that emitted tons of carbon dioxide into the atmosphere. The melting sped up dramatically in the 20th and 21st centuries, and shows no signs of abating.
“We were able to show for the first time, and unequivocally, that the current melt and runoff in Greenland is unprecedented and is also increasing at an accelerating rate,” she said.
As a geologist, Das tries to frame her work in Earth-history time scales—far longer than the brief (years-to-decades) modern observational record—to put today’s rapid changes into a larger perspective and to inform how the future might unfold.
While calving icebergs represent one highly visible aspect of rising sea levels, more than half of the Arctic water pouring into the ocean comes from runoff from melted snow and glacial ice. Between 2005 and 2014, loss of ice mass from the Greenland ice sheet alone accounted for a fifth of global mean sea level rise. Now the second-largest contributor to rising seas worldwide, Greenland is on track to become the top source of added water.
Das’s study drew on data gleaned from ice cores extracted from more than 100 meters (about 330 feet) down into the ice, frozen records by which she reconstructed past melt intensity year by year. She found that, rather than increasing in a steady linear trend as climate warms, the melt rate trajectory of Greenland’s ice sheet is “nonlinear,” curving up faster and faster for every degree of warming. According to Das, compared to even the late 19th century, it now takes very little additional warming to trigger huge spikes in ice sheet melting and runoff.
Warmer air temperatures, which are amplified in the Arctic, bring more summer heat, more melt, and more ice loss to the ocean. At the same time, warmer waters lapping Greenland’s shores creep up on the ice sheet from the edges and the underside, causing the ice to melt faster and to calve off into icebergs.
Current projections of sea level rise range from 0.3 to 1.5 meters (one to five feet) between the years 2000 and 2100, and from 1.0 to 12 meters (three to 38 feet) between the years 2000 and 2300, with a large part of that projected to come from increased land ice loss. While the Intergovernmental Panel on Climate Change (IPCC) projections take into account many aspects of the atmospheric part of the ice-loss process, they don’t account for all of the newly understood, ocean-driven dynamic changes in glacial behavior—especially the melting of ice from underneath by warm waters—that may prove to be far more consequential, especially in the continent-size ice sheet at the bottom of the globe.
“Antarctica is still the biggest wild card when it comes to ice loss,” said Das. Projections indicate that if all of Greenland’s ice melted, the global sea level would rise by nearly seven meters (24 feet)—which is frightening enough, but if all of Antarctica liquefied, global seas would rise by more than 61 meters (200 feet).
This article was originally published as part of the in-depth feature “Oceans of Change” in the Fall 2019 issue of Oceanus, Woods Hole Oceanographic Institution’s member magazine. Click here to become a member.
